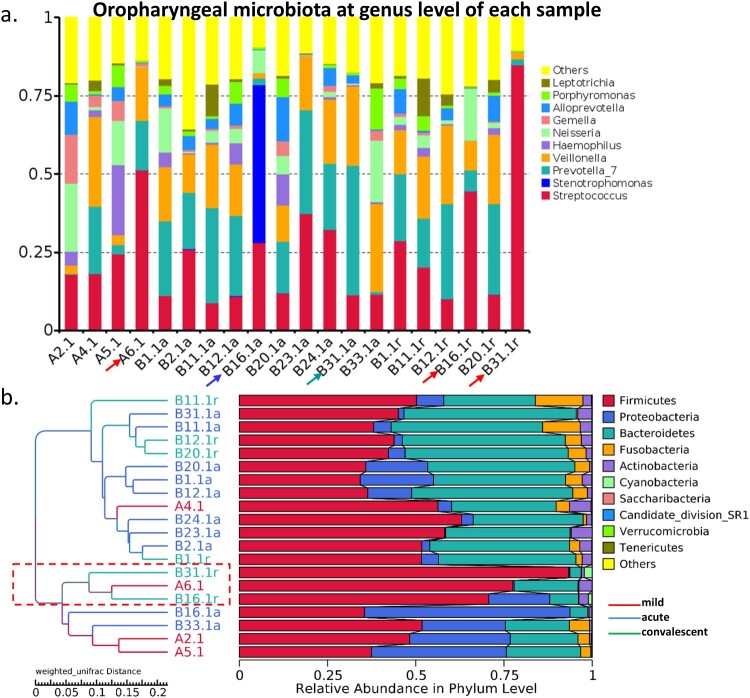
Figure 5.
Oropharyngeal bacterial composition of each sample. (a) Bacterial composition of each sample at the genus level. (b) Tree based on weighted UniFrac distances of each sample at phylum level. Different coloured arrows represent different predominant bacteria, corresponding to different groups.

