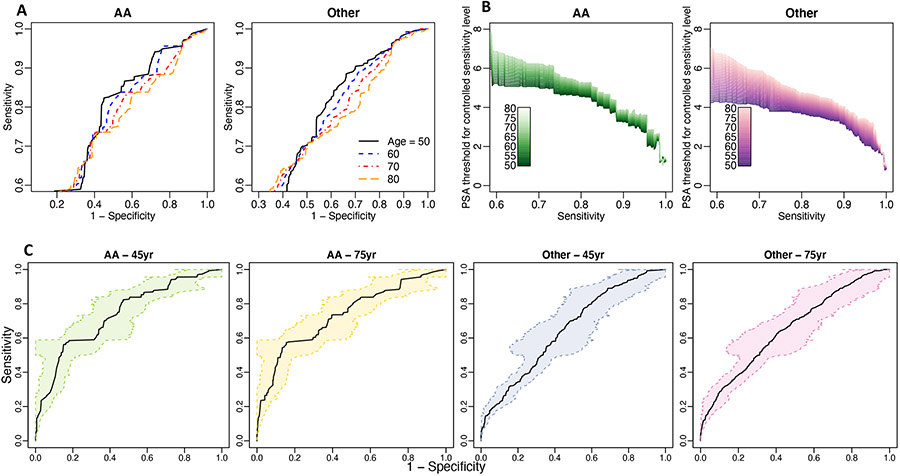
FIGURE 2.
Results from applying the proposed method to PSA of the NCI-EDRN cohort. Panel A is the monotonized ROC curve. Panel B is the PSA threshold for controlled sensitivity level for different race and age groups. Panel C is the 95% bootstrap-based confidence band for the monotonized ROC curve in different subpopulations.

