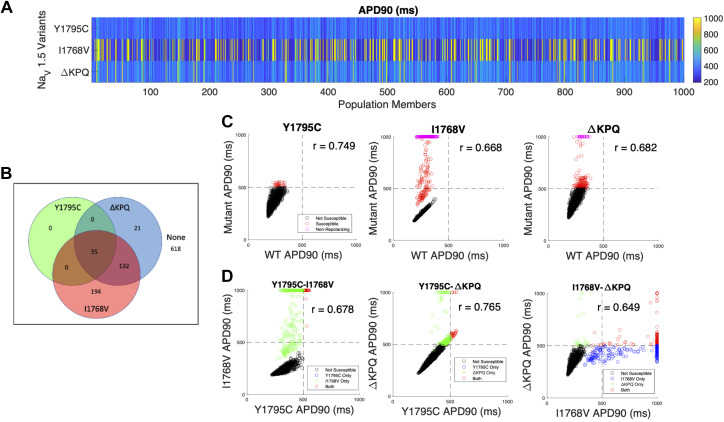
Figure 8.
Fixed θNa population overview illustrating action potential duration (APD) prolongation for different mutations. A: APD at 90% repolarization (APD90) for 1,000 cells, shown by row for Y1795C, I1768V, and ΔKPQ (top to bottom). B: Venn diagram illustrating susceptibility categorization for all 3 mutations. C: comparison between wild-type (WT) and mutant APD90 for each mutation. Unlike in the variable θNa population, there is a strong correlation between WT and mutant APD90 for all mutations. D: direct comparison of APD90 for all cells in the population with 2 different mutations. Horizontal and vertical lines at 500 ms indicate the threshold of APD prolongation between cells susceptible or not susceptible to a given mutation. Note that the inclusion of early afterdepolarizations (EADs) in the susceptibility criteria results in some cells with APD < 500 ms also in the susceptible quadrants.

