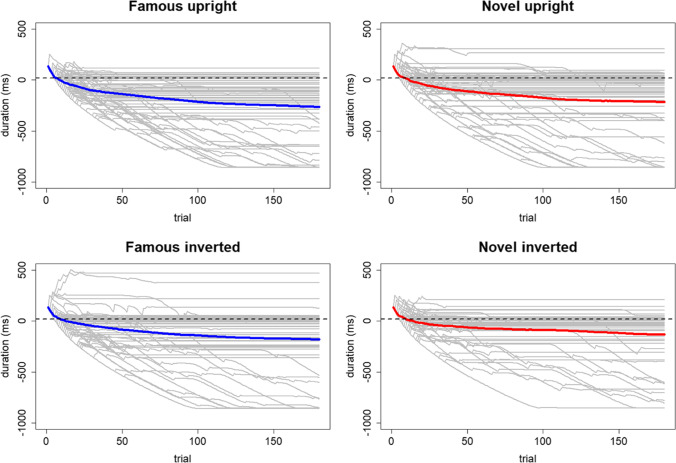
Fig. 8.
The estimated duration traceplots of each participant under each condition. The y-axis is the estimated duration by the Quest algorithm. The x-axis is the trial numbers. Each grey line represents one participant. The average of each condition was the thick colored line. The estimated duration needed for famous faces (blue trace) was shorter for novel faces (red trace), and the estimated duration for upright faces (top row) was shorter than inverted faces (bottom row). See Results section for explanation of the negative values

