
Figure 2.
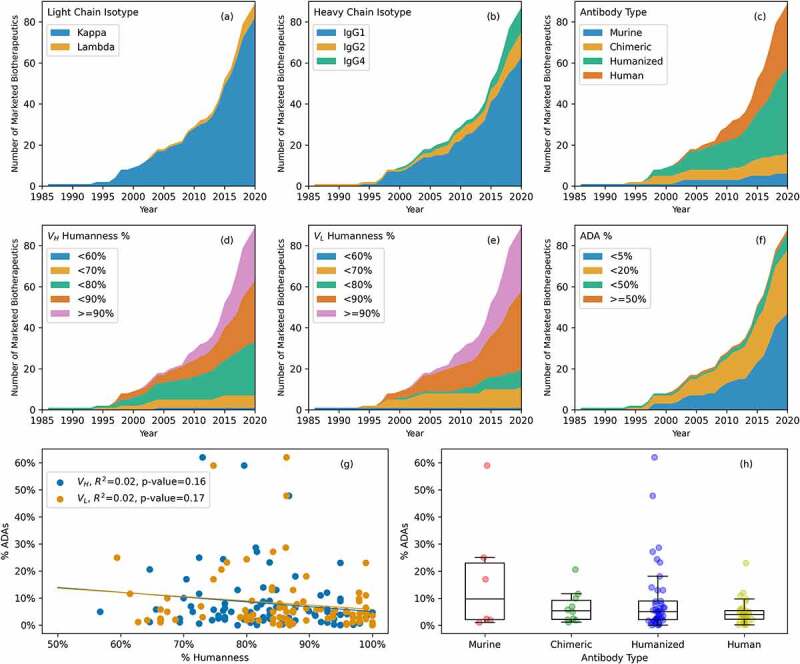
(a) Light chain isotypes of marketed antibody-based biotherapeutics over time. Kappa isotypes are much more common than lambda isotypes. (b) Heavy chain isotypes of marketed antibody-based biotherapeutics over time. IgG1 is the most common heavy isotype, while IgG2 and IgG4 are equally common. (c) Types of marketed antibody-based biotherapeutics over time. Murine and chimeric were common early on, but nearly all approved marketed antibody-based biotherapeutics are now either human or humanized. (d) Heavy chain variable region (VH) percent humanness over time. VH humanness is commonly between 70 and 90%. (e) Light chain variable region (VL) percent humanness over time. VL humanness is commonly between 80 and 90%. (f) Reported percent anti-drug antibodies (% ADAs) over time. In recent years it is much more common to see a reported % ADAs below 5%. (g) Comparison of % Humanness and % ADAs. There is no statistically significant correlation between % Humanness and % ADAs reported for the marketed antibody-based biotherapeutics. (h) % ADAs by antibody type. In general, % ADAs decrease from murine to human, however a direct comparison of % ADAs across the products should be interpreted with caution (see results).