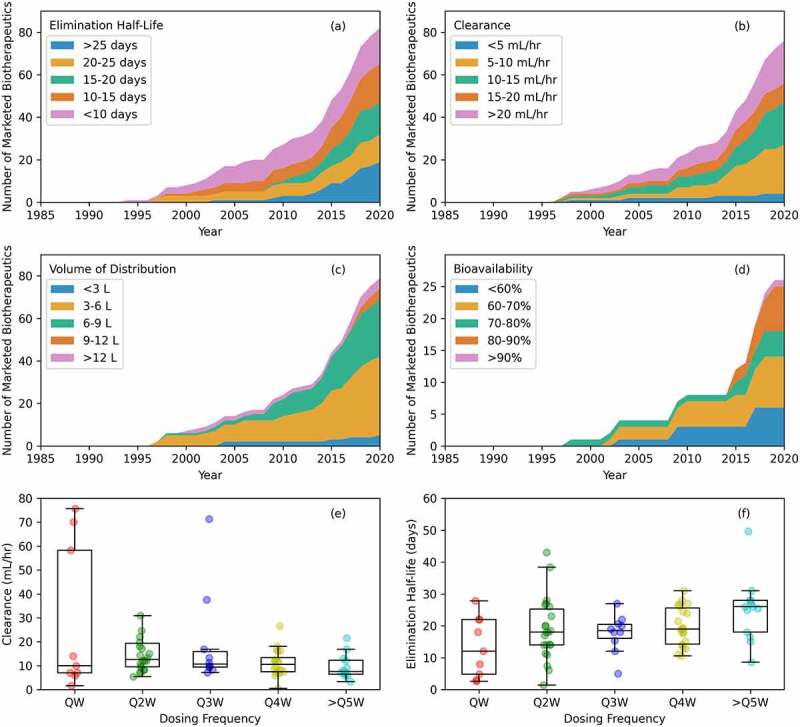
Figure 4.

Pharmacokinetic (PK) data over time. (a) Elimination half-life. This varies for all antibody-based biotherapeutics, but most marketed products are eliminated between 15 and 25 days. (b) Clearance. This varies too, but most antibody-based biotherapeutics have a clearance between 5 and 15 mL/hour. (c) Volume of distribution. Values fall mainly between 3 and 9 liters with values between 3 and 6 liters being the most common. (d) Bioavailability. Recent marketed drugs with a subcutaneous route of administration commonly have 90% or more bioavailability. (e) Clearance versus dosing frequency. In general, a higher clearance should result in more frequent dosing, but the median values do not reflect this. (f) Elimination half-life versus dosing frequency. A trend of longer elimination half-lives enabling less frequent dosing is observed.
