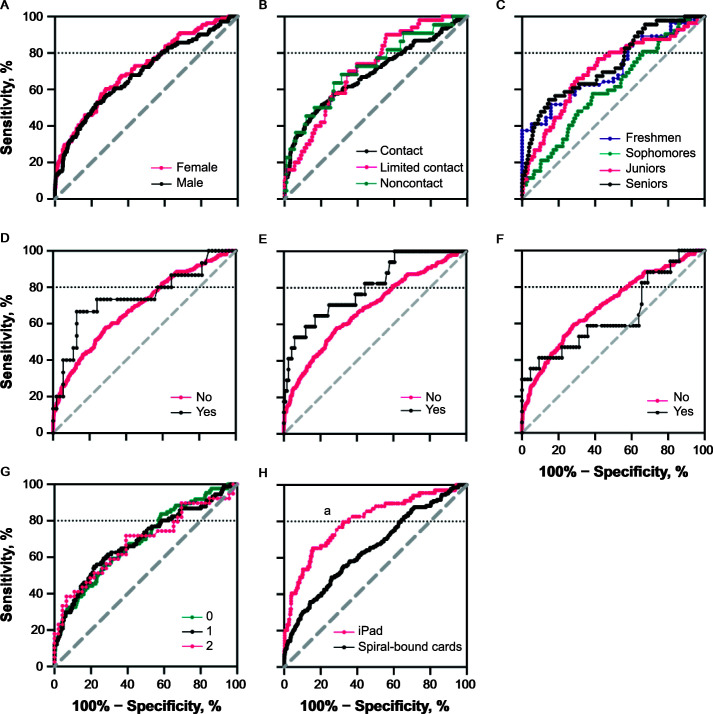
Figure 2.
Receiver operating characteristic curves at the within–48-h time point segmented by, A, sex, B, sport contact level, C, academic year, D, learning disorder, E, attention-deficit/hyperactivity disorder, F, migraine history, G, concussion history, and H, administration mode (P < .05). The horizontal dotted line at y = 80 indicates 100% specificity at a sensitivity of 80%. a Indicates difference in area under the receiver operating characteristic curve (P < .001).

