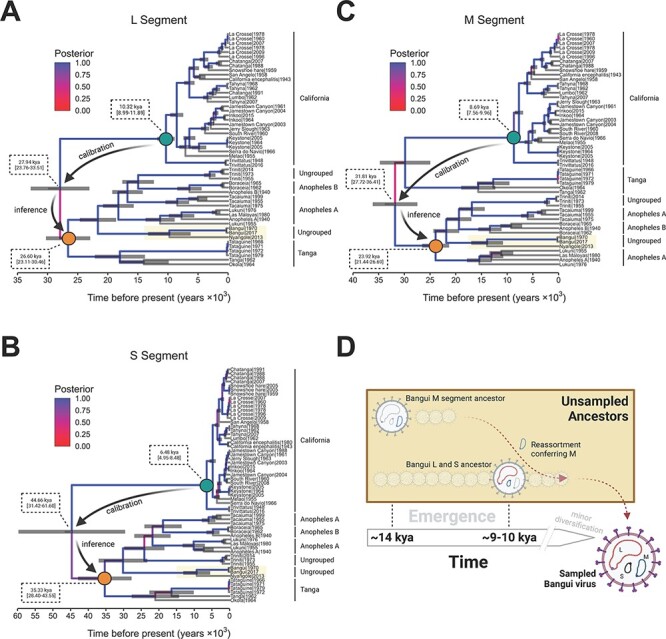
Figure 3.

The temporal reconstruction of the emergence of Bangui virus and the closest phylogenetically related viral species. (A–C) MCC trees based on the three genomic segments (L, M, and S) for all the viral species evaluated. Each time-scaled phylogeny resulted from the calibration of the evolutionary rate using the California serogroup viruses. The branches are colored according to posterior probability, and median ages with 95 per cent HPD confidence are shown at ancestral nodes. The process utilized to infer the ancestrality of the Tanga/Anopheles serogroup (orange dot) through calibration using the California serogroup (green dot) is highlighted in each tree. (D) The evolutionary model depicting the ancient reassortment and mutation events that resulted in the emergence of the sampled Bangui virus.
