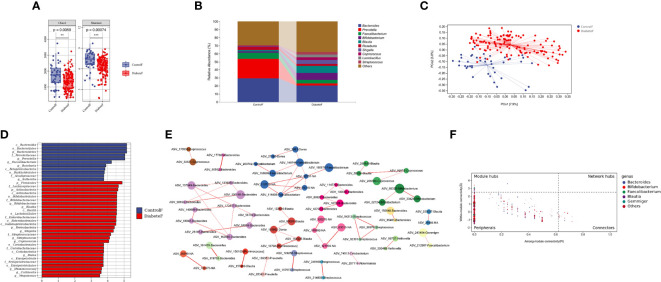
Figure 3.
Distribution characteristics of intestinal microbiota in patients with type 2 diabetes (Figure (A) is the a Diversity results; Figure (B) is the composition of intestinal flora in both groups (top 10 genera); Figure (C) is the results of the PeoA analysis; Figure (D) is the LEfSe analysis results of intestinal microbiota in patients with T2DM (the LDA threshold is 3.5); Figure (E) is the co-abundance network diagram of intestinal flora in patients with T2DM; Figure (F) is the Zipi diagram of intestinal flora in patients with T2DM). **represents P<0.01 , *** represents P<0.001.

