Figure 4.
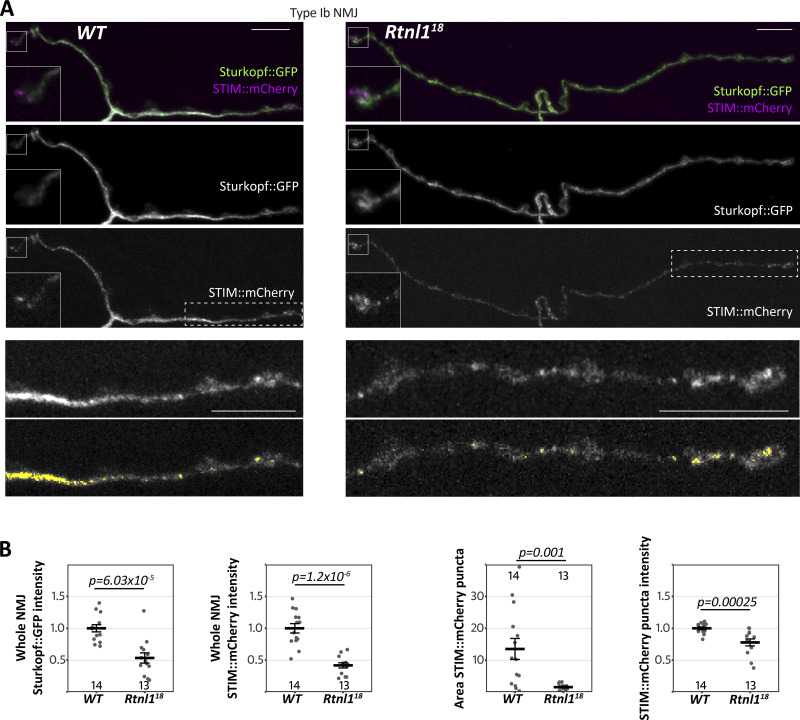
Rtnl1 loss depletes presynaptic STIM and reduces STIM foci. (A) Representative confocal projections showing the ER markers STIM::mCherry and Sturkopf::GFP in Type Ib muscle 1 NMJs of WT and Rtnl118 larvae. Insets in the top three rows show a magnified view of terminal boutons. Bottom panels show magnified views of the areas indicated with a broken line. Areas of elevated STIM (“foci”) are sometimes punctate and sometimes extended and are highlighted in yellow in the bottom panels. Scale bars, 10 μm. Insets, 6 × 6 μm. (B) Plots show individual larval datapoints and mean ± SEM; intensity levels indicate arbitrary units (au) after normalization to control (WT). Larval datapoints were calculated and are shown as in Fig. 2; Except for Sturkopf::GFP intensity (Student’s t test), pairwise comparisons were performed with Mann–Whitney U tests. Genotypes are Ib-GAL4, UAS-Sturkopf::GFP/UAS-STIM::mCherry, in either a WT or Rtnl118 background.

