Figure S2.
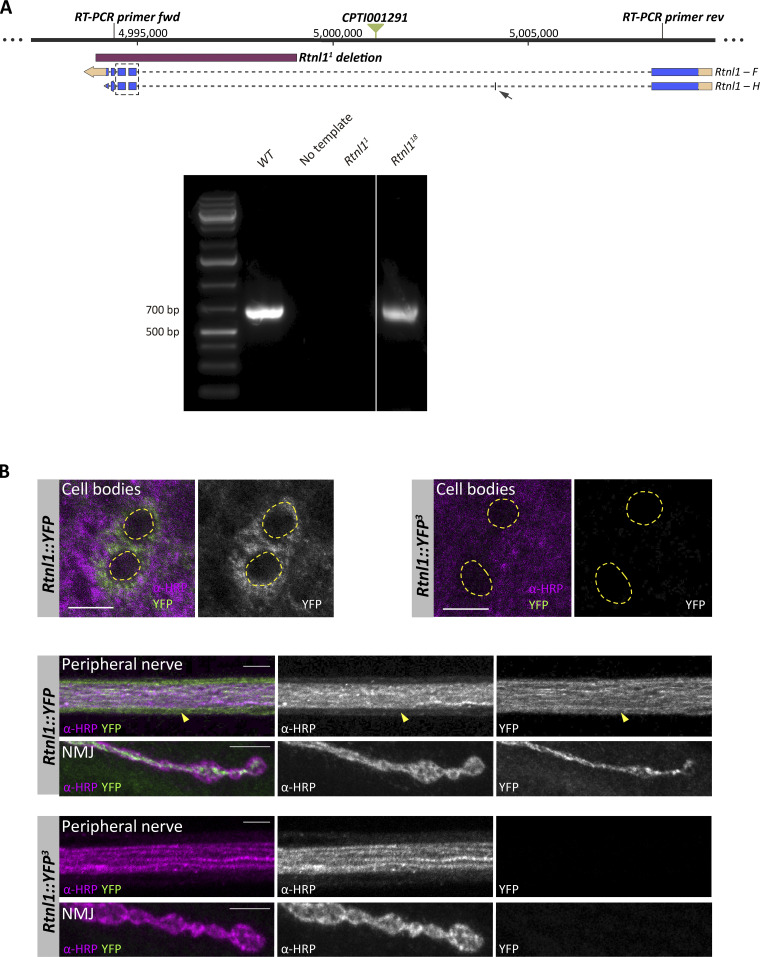
Effects of Rtnl1 mutant CRISPR alleles on Rtnl1 expression. (A) RT-PCR strategy to test presence of Rtnl1 transcripts (top). For the Rtnl1 isoforms shown, blue boxes indicate exons, broken lines indicate introns, light orange boxes indicate 5′ and-3′ UTRs, and arrows indicate the direction of transcription. A green triangle shows the position of the Rtnl1::YFP exon trap insertion (CPTI001291). Genomic coordinates are based on Release 6.26 of the D. melanogaster genome (http://flybase.org). Using the indicated primers, the expected amplicon from genomic DNA is around 14 kb. The expected amplicon for Rtnl1 transcript F is 636 bp, and for transcript H is 672 bp, due to an extra small exon (arrow). The box surrounded by a broken line shows the region containing Rtnl118 lesions. Agarose gel electrophoresis (1%) of reverse-transcribed cDNA (bottom) shows that Rtnl118 does not disrupt Rtnl1 mRNA transcription. For both WT and Rtnl118 alleles, only one amplicon is seen, which is slightly smaller in Rtnl118, due to the small deletions totaling 25 bp within the amplified region (see Fig. 1 A and Fig. S1 A for details). (B) Confocal sections of neuronal cell bodies, peripheral nerves and NMJs (muscle 1) show that Rtnl1::YFP3 mutation is enough to abolish Rtnl1::YFP expression. In cell bodies, nuclei are distinguished by the absence of α-HRP signal (dotted line regions). On the peripheral nerve, glia can be distinguished from neuronal axons due to the low levels of α-HRP signal (arrowhead). All larvae are also expressing Ib-GAL4, but this is not driving any reporter expression. Scale bars, 5 μm. Source data are available for this figure: SourceData FS2.

