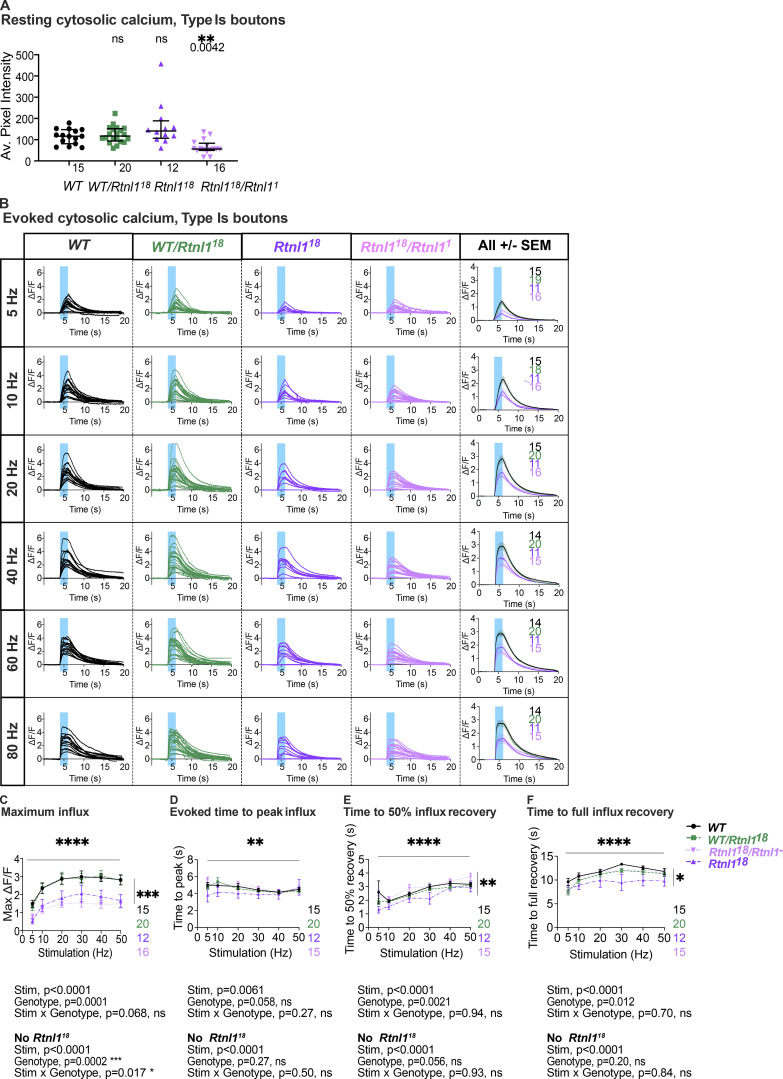
Figure S9.
Rtnl1 loss decreases cytosolic Ca2+ handling in Type Is boutons. (Extended data from Fig. 5.) (A) Loss of Rtnl1 does not affect resting myrGCaMP6s fluorescence. Rtnl118/Rtnl11 flies show a decrease in myrGCaMP6s fluorescence, but this effect is not replicated in a homozygous Rtnl118 background, indicating that loss of Rtnl1 does not affect resting cytosolic Ca2+. The plot shows individual larval datapoints and median ± interquartile ranges; sample size (larvae) is indicated within the plot for each genotype. The pairwise comparison performed was a Kruskal–Wallis test. (B) Impact of Rtnl1 loss-of-function on peak evoked cytosolic Ca2+ responses. Plots show all single time traces, as well as mean ± SEM time traces in every genotype for six stimulation frequencies tested. Sample size is indicated within the plot for each genotype. (C) Rtnl1 loss of function decreases peak evoked cytosolic Ca2+. Datapoints represent mean ± SEM of the largest ΔF/F reached after stimulation during the recording, shown in B. (D) Rtnl1 loss did not affect time to peak cytosolic Ca2+. Datapoints represent the time between stimulation and peak ΔF/F. Comparisons were analyzed as in C. (E and F) Rtnl1 loss did not affect time recovery from evoked cytosolic Ca2+ influx. Although the mixed-effects two-way ANOVA records a significant genotypic effect in both time to 50% recovery (E) and 100% recovery (F), two-way ANOVAs without the Rtnl118 group erase this significance, indicating that Rtnl18/Rtnl1 transheterozygotes are not significantly different from controls in these assays and that the effect is likely due to the homozygosity of the chromosome carrying Rtnl118, and not to the loss of Rtnl1. Datapoints represent the time between peak ΔF/F and 50% or 100% recovery. Comparisons were analyzed as in C. In C–F, plots show mean ± SEM of every genotype for each stimulation frequency tested; sample size (larvae) is indicated within the plot for each genotype. For each larva, responses from a 20 s recording from one muscle 1 NMJ between segments A4-A6 were analyzed. Comparisons were analyzed with a mixed-effects two-way ANOVA. (A–F) Genotypes are Is-GAL4, UAS-myrGCaMP6s/UAS-tdTom::Sec61β, in either a WT, or Rtnl118, Rtnl118/Rtnl11, or WT/Rtnl118 background.

