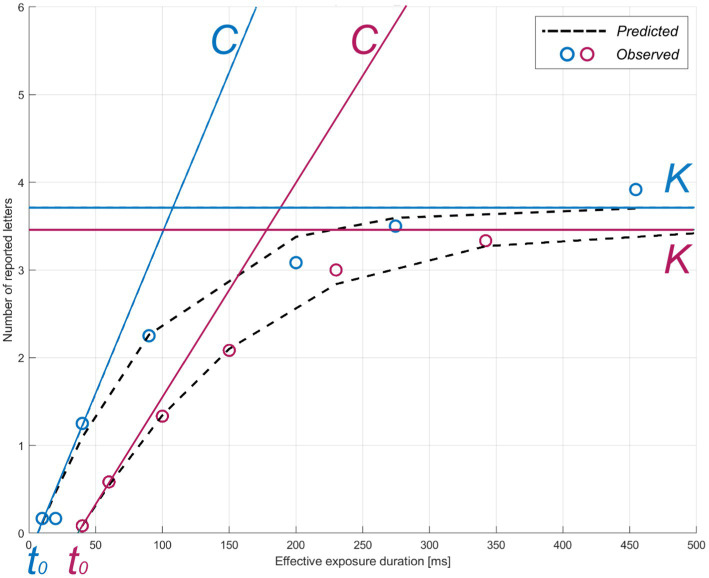
Figure 2.
TVA parameter estimation for two representative participants. The theory of visual attention (TVA) estimation curve for accuracy as a function of exposure duration is shown for two example individuals (pink: greater subjective cognitive complaints, z-score = 1.09; blue: lower subjective cognitive complaints, z-score = −0.860) in the whole-report task. Parameters: C = visual processing speed; K = visual short-term memory storage capacity; t0 = visual perceptual threshold. Circles indicate each individual’s mean observed performance across conditions. The dotted black curves indicate each individual’s predicted performance across exposure durations.

