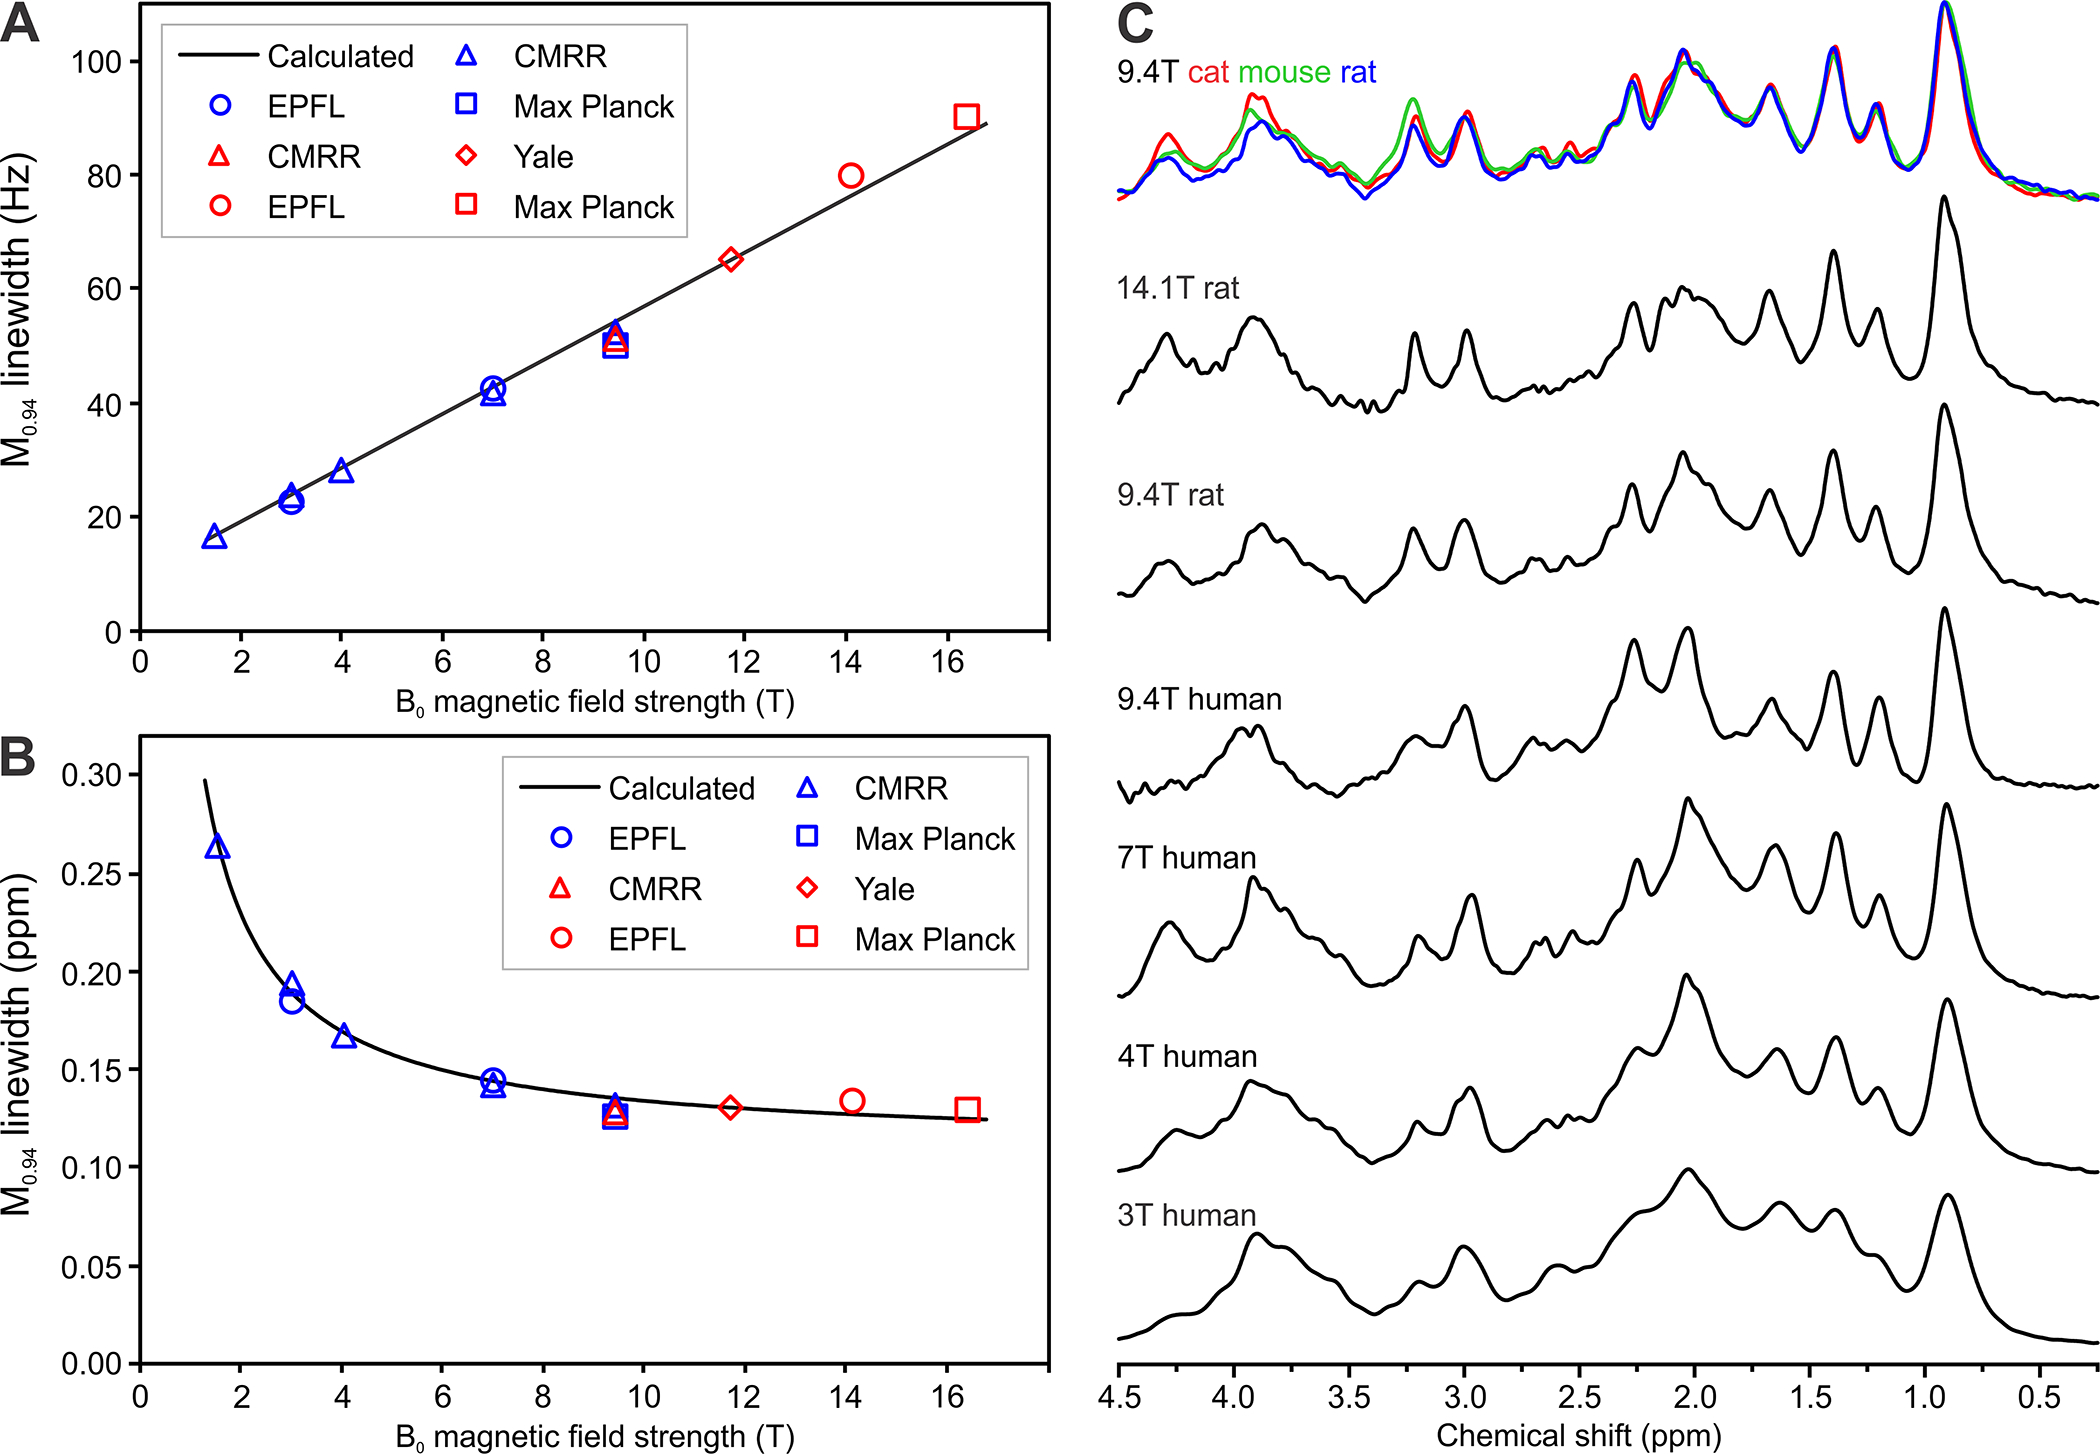
Figure 1:

B0 dependence of MM acquired in vivo using 1H MRS.
(A) Dependence of M0.94 signal linewidth on B0 with linewidth expressed in Hz;
(B) Dependence of M0.94 signal linewidth on B0 with linewidth expressed in ppm. Lines calculated for parameters T2 = 32 ms and Δν* = 4.73 Hz/T. Experimental values were assessed using spectra from the CMRR database, spectra provided by co-authors of this paper and spectra from papers27,58,80,81,136. Blue symbols: human MM spectra, red symbols: animal MM spectra.
(C) MM spectra acquired in vivo from the brain of different species at 9.4 T and from human and rat brain at different B0 showing noticeable increased spectroscopic resolution
Spectra are from the following centres: CIBM-EPFL (Centre d’Imagerie Biomedicale, Ecole Polytechnique Federale de Lausanne, Lausanne, Switzerland), CMRR (Center for Magnetic Resonance Research, University of Minnesota, Minneapolis, MN, USA), Max Planck Institute for Biological Cybernetics (Tuebingen, Germany).
Spectra are available online here: https://forum.mrshub.org/t/data-submission-mm-consensus-data-collection/92
