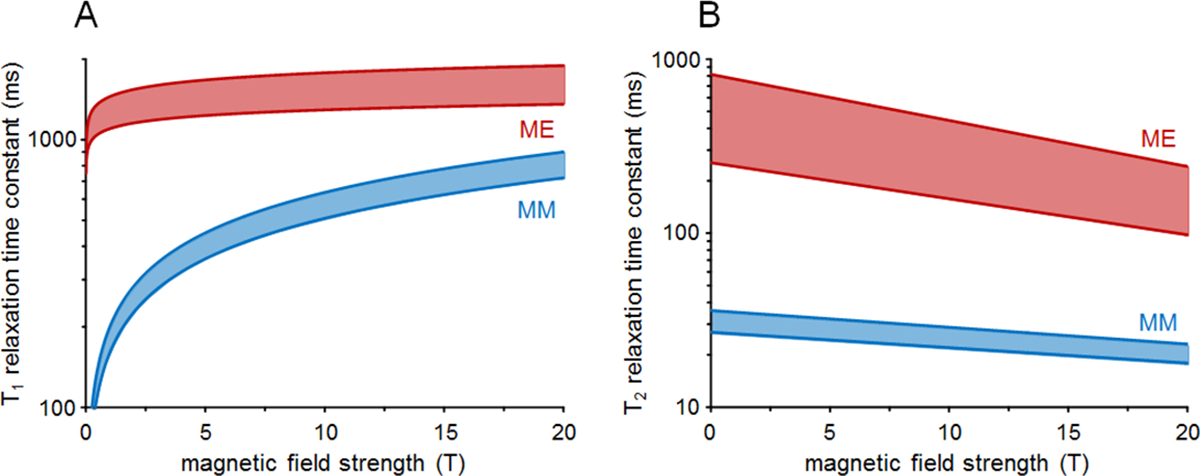
Figure 2:

B0 dependence of metabolite (ME) and macromolecule T1 (A) and T2 (B) relaxation. The indicated metabolite ranges include T1 and T2 values for NAA methyl, total creatine methyl and choline methyl signals published in rat2,29,41 and human brain42, whereas the indicated MM ranges include T1 and T2 values for the M0.94 (M1) to M1.70 (M4) signals published in rat brain2,29. Note the logarithmic vertical scale.
