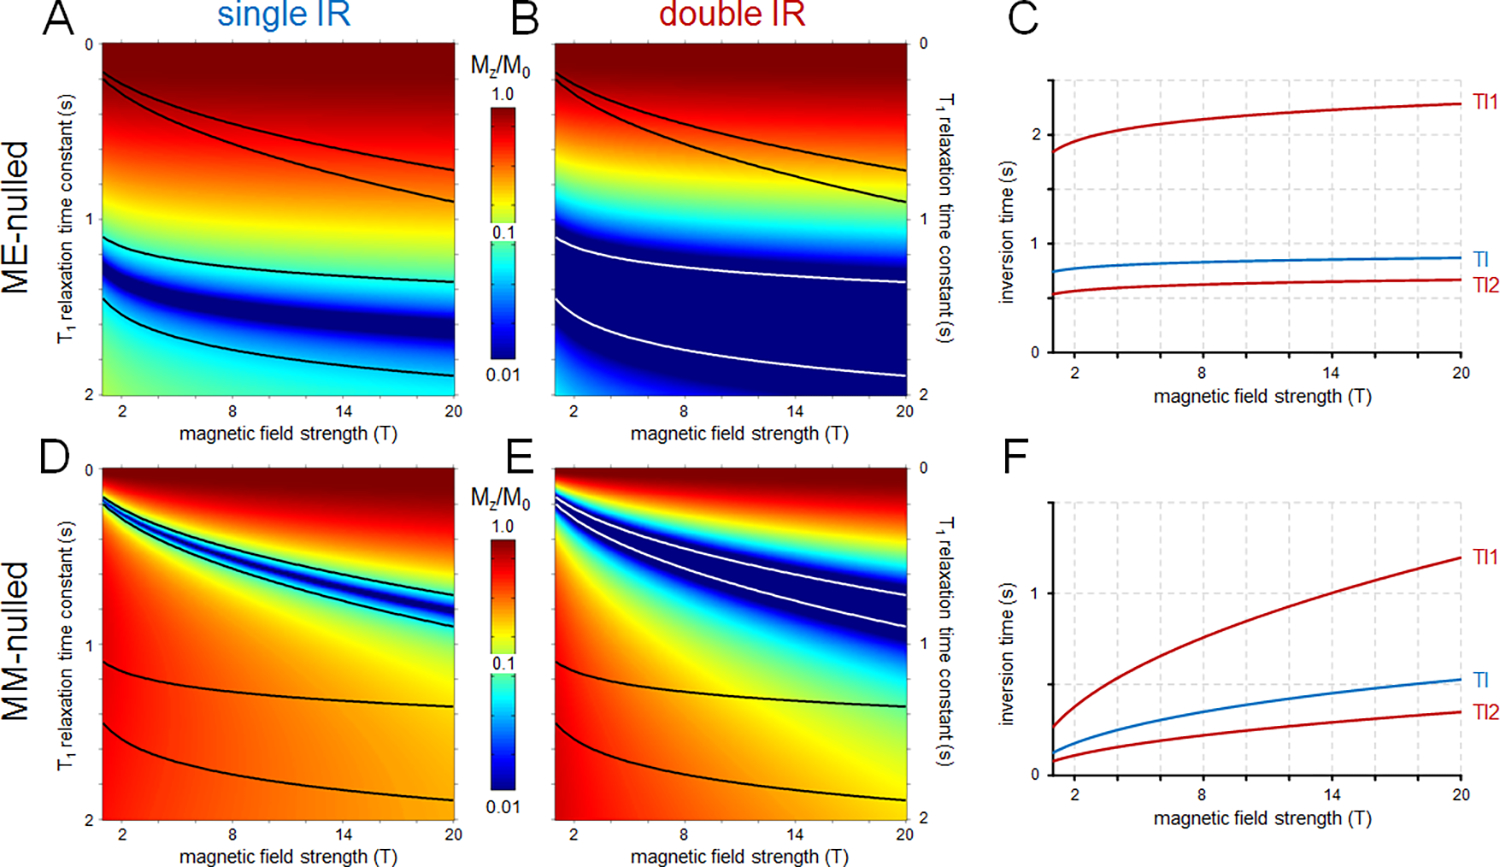
Figure 3:

Signal suppression and recovery for (A-C) metabolite-nulled (labelled as ME) and (D-F) MM-nulled MR spectroscopy using (A, D) single inversion recovery (IR, TR=2s) and (B, E) double IR (TR=5s) acquisition strategies as a function of B0 and T1 relaxation time constant published for rat brain. The black and white lines indicate the metabolite and/or MM T1 relaxation ranges. Note the logarithmic vertical scale for all color maps. (C, F) B0 dependence of the optimal inversion recovery times for (C) metabolite-nulled and (F) MM-nulled MRS. The inversion times are optimized to provide the best signal suppression over the T1 ranges indicated in (A, B, D and E). Optimal inversion times for single (TI) and double IR (TI1/TI2) are shown in blue and red, respectively. The Matlab code used to generate these data can be found in Appendix 2.
