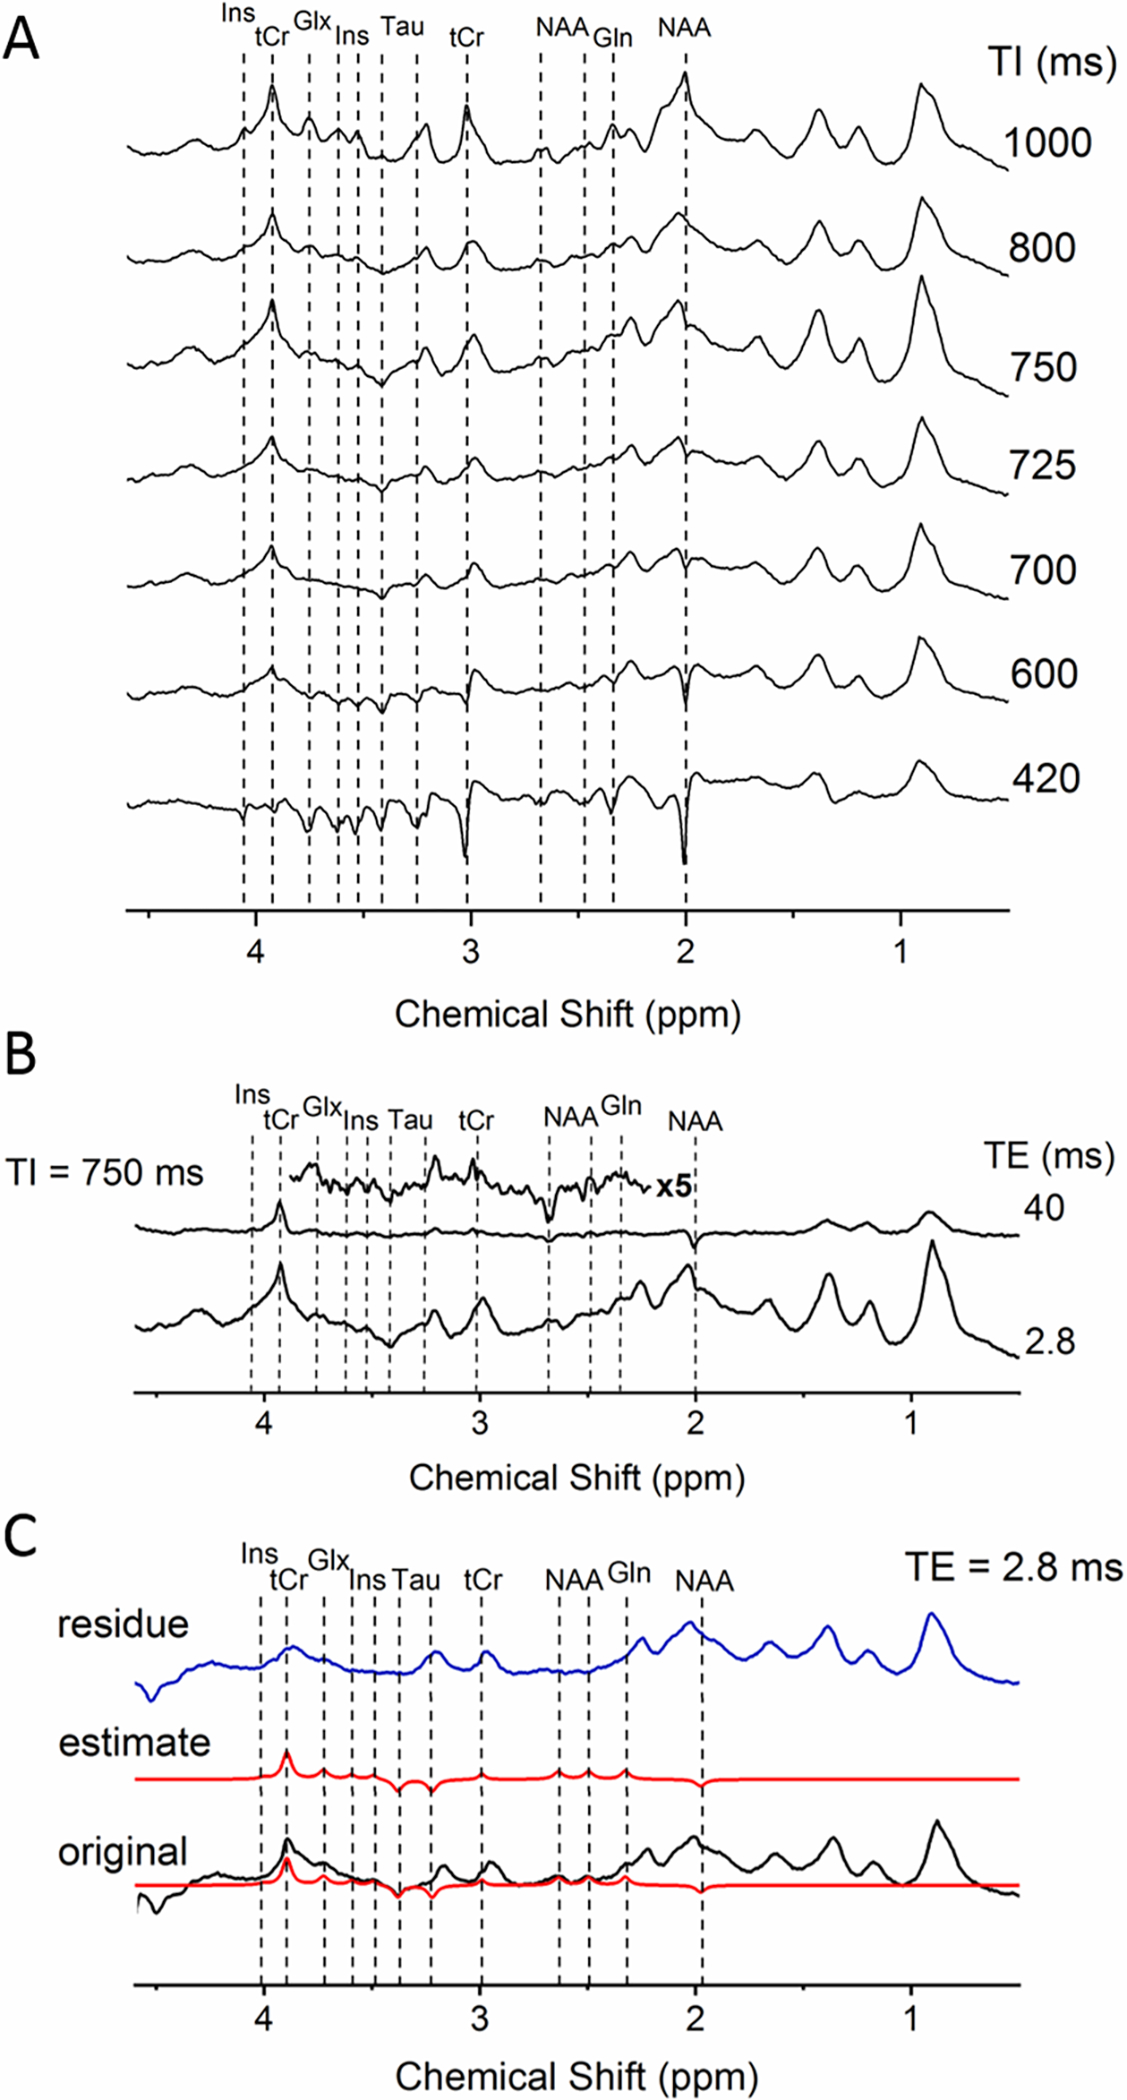
Figure 4:

A) A series of IR spectra from rat brain in vivo with TI ranging from 420 to 1000 ms revealing the evolution of metabolite intensities as a function of TI (all the spectra were acquired with TE/TR=2.8/2500 ms at 9.4 T using the SPECIAL sequence in a voxel of 3×3×3mm3 centered in the hippocampus); B) Spectra acquired with a selected TI (750 ms) and TE of 2.8 ms (taken from A) as well as with TE of 40 ms (5x magnified, TE=40 ms spectrum from 2.2–3.8 ppm is shown on the top); C) Original spectra acquired at TI of 750 ms and TE of 2.8 ms (shown in black), estimated fits of the residual metabolites using AMARES (shown in red), and the residue obtained after subtraction of the estimated metabolite signals from the original spectrum (shown in blue). All spectra were acquired in vivo in the rat brain at 9.4 T.
