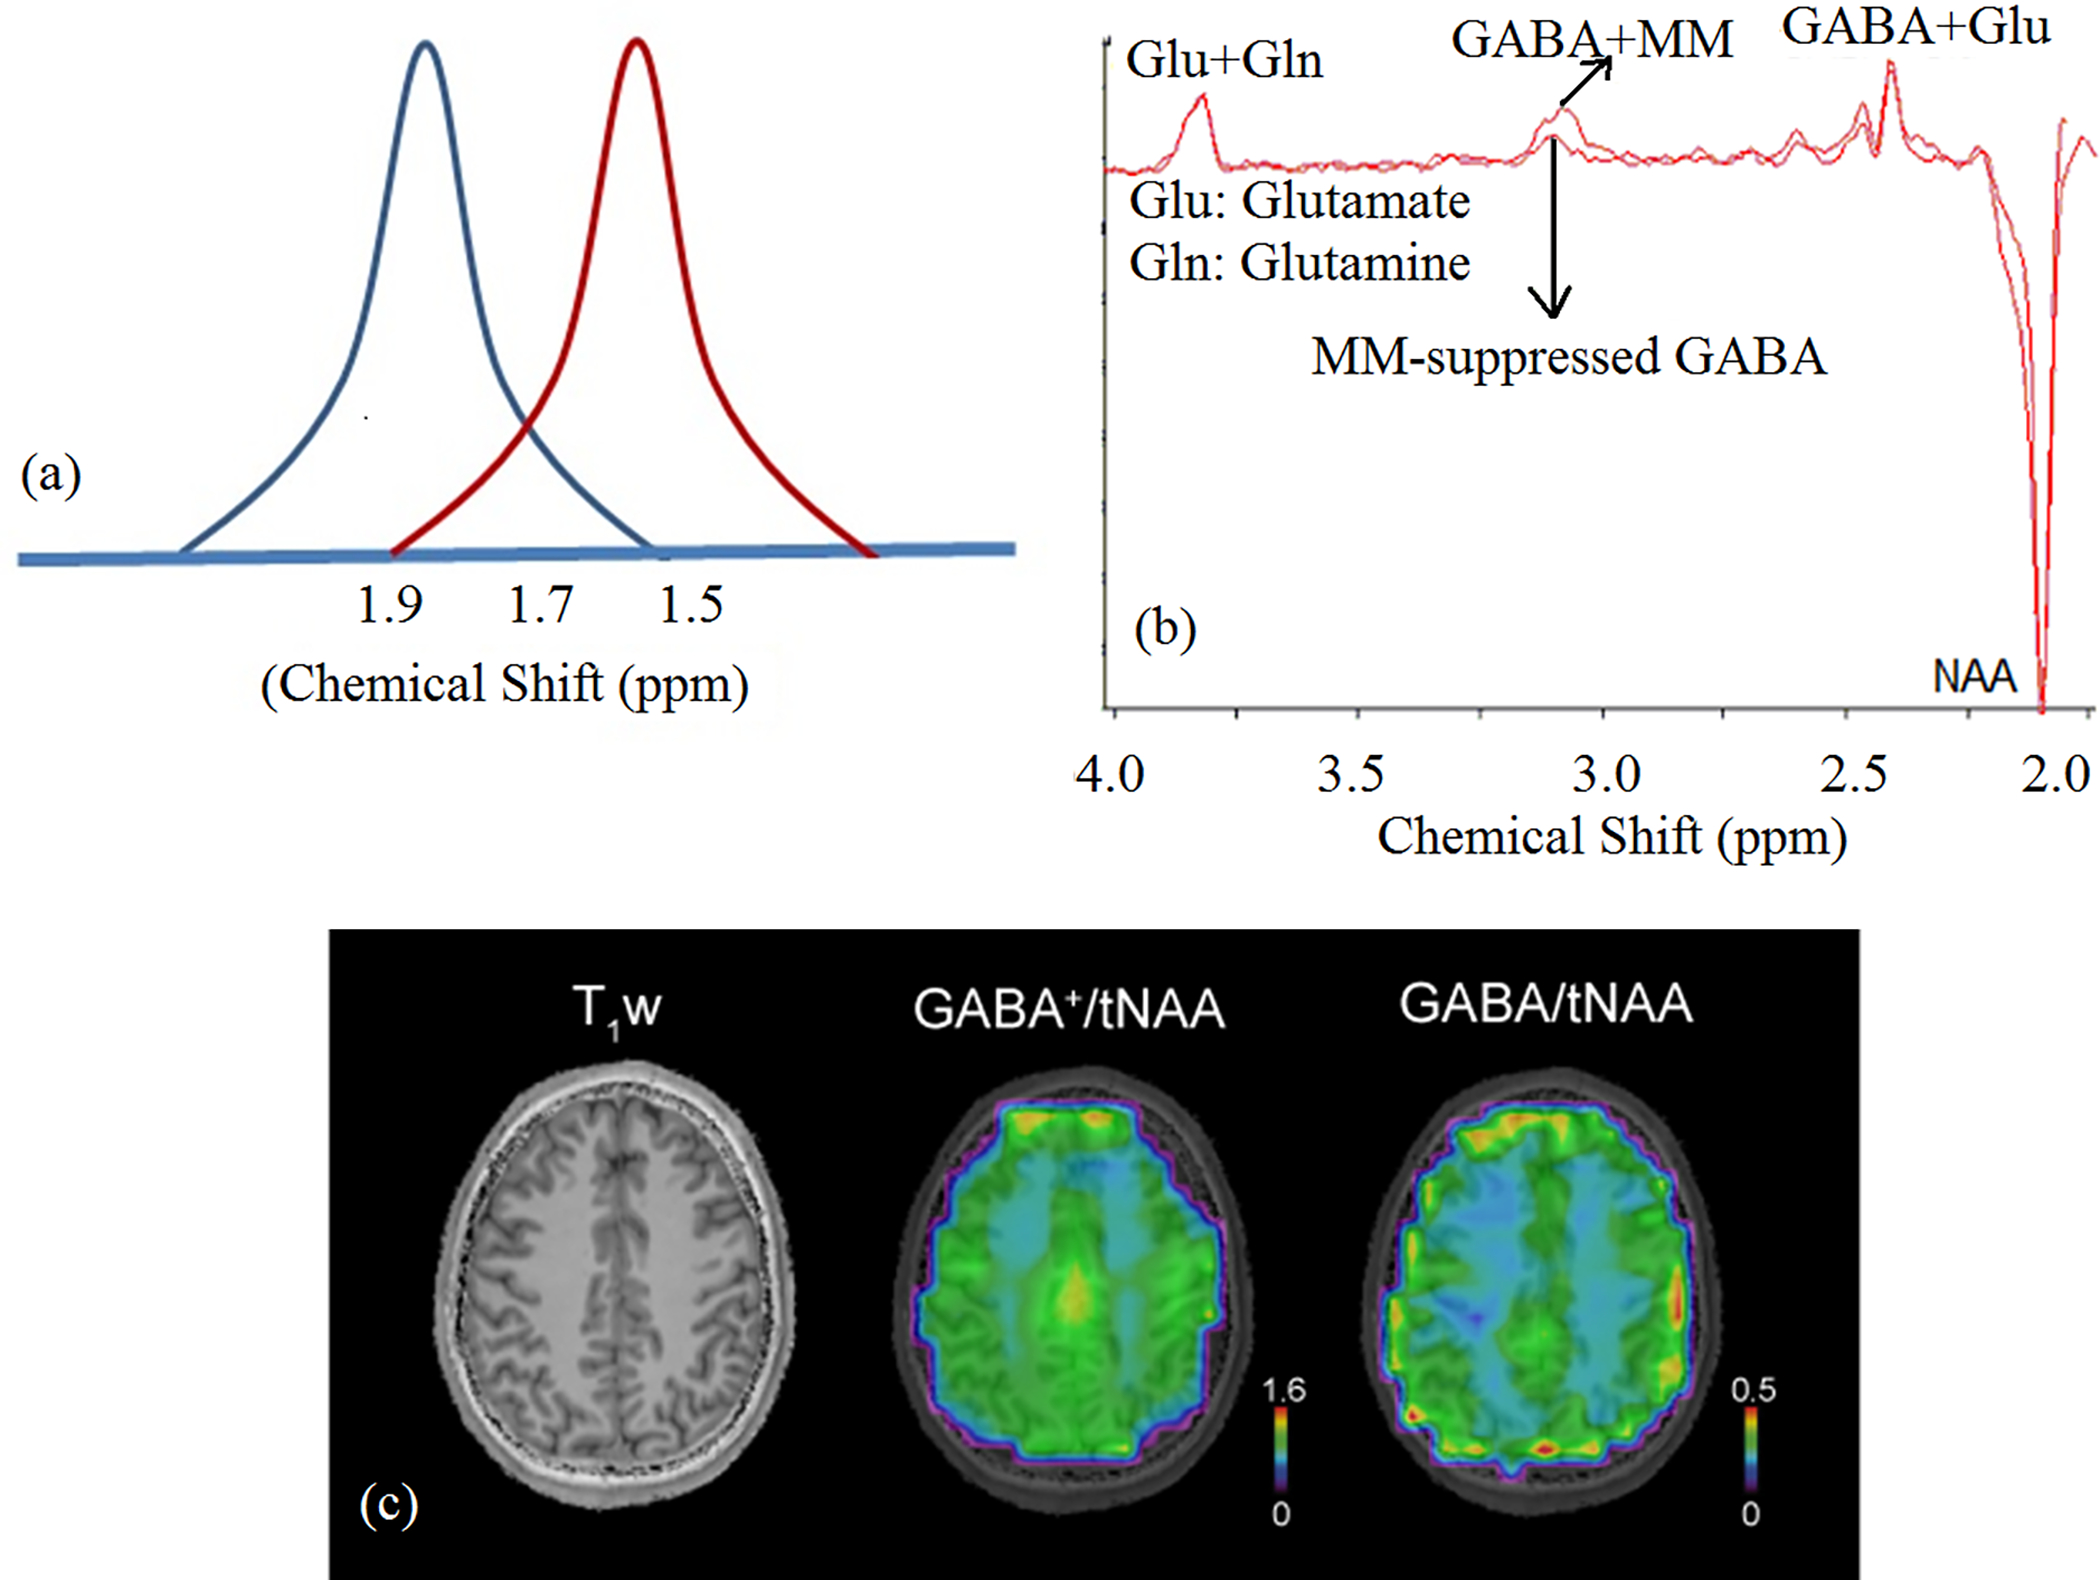
Figure 6.

A) Schematic representation of MM coediting. Gaussian pulse (blue) set at 1.9 ppm partially excites 1.7 ppm MM resonance to result in MM coediting. In symmetric pulsing, the ON and OFF resonance pulses are set at 1.9 (blue) and 1.5 ppm (red) respectively, resulting in MM-suppressed GABA signal104. B) Single-subject MM-coedited GABA (GABA+MM) and MM-suppressed GABA spectra using symmetric pulsing with MEGA-LASER sequence at 7 T. (Adapted from reference137 with permission); C) T1-weighted MRI, metabolic maps of GABA+/tNAA (i.e. GABA+MM3.00) and GABA/tNAA (7 T, nominal voxel volume ~1.4 ml, GABA measured using IR MM-nulling100). The GM/WM contrast increased 2.15-fold in GABA/NAA compared to GABA+/NAA, as also shown in a previous study using MQ GABA editing138. This may be attributed to a reduced dilution effect of MM contribution that has less contrast between GM and WM than GABA and to an elevated abundance of the underlying MM component (M3.00) in WM, but further investigation is needed. (Note: tNAA measured with EDIT-OFF IR-ON was used for normalization in both cases). MM-suppressed MEGA-edited GABA measurement139 has shown similar GM/WM difference of GABA as MQ GABA editing138.
