
Figure 7:
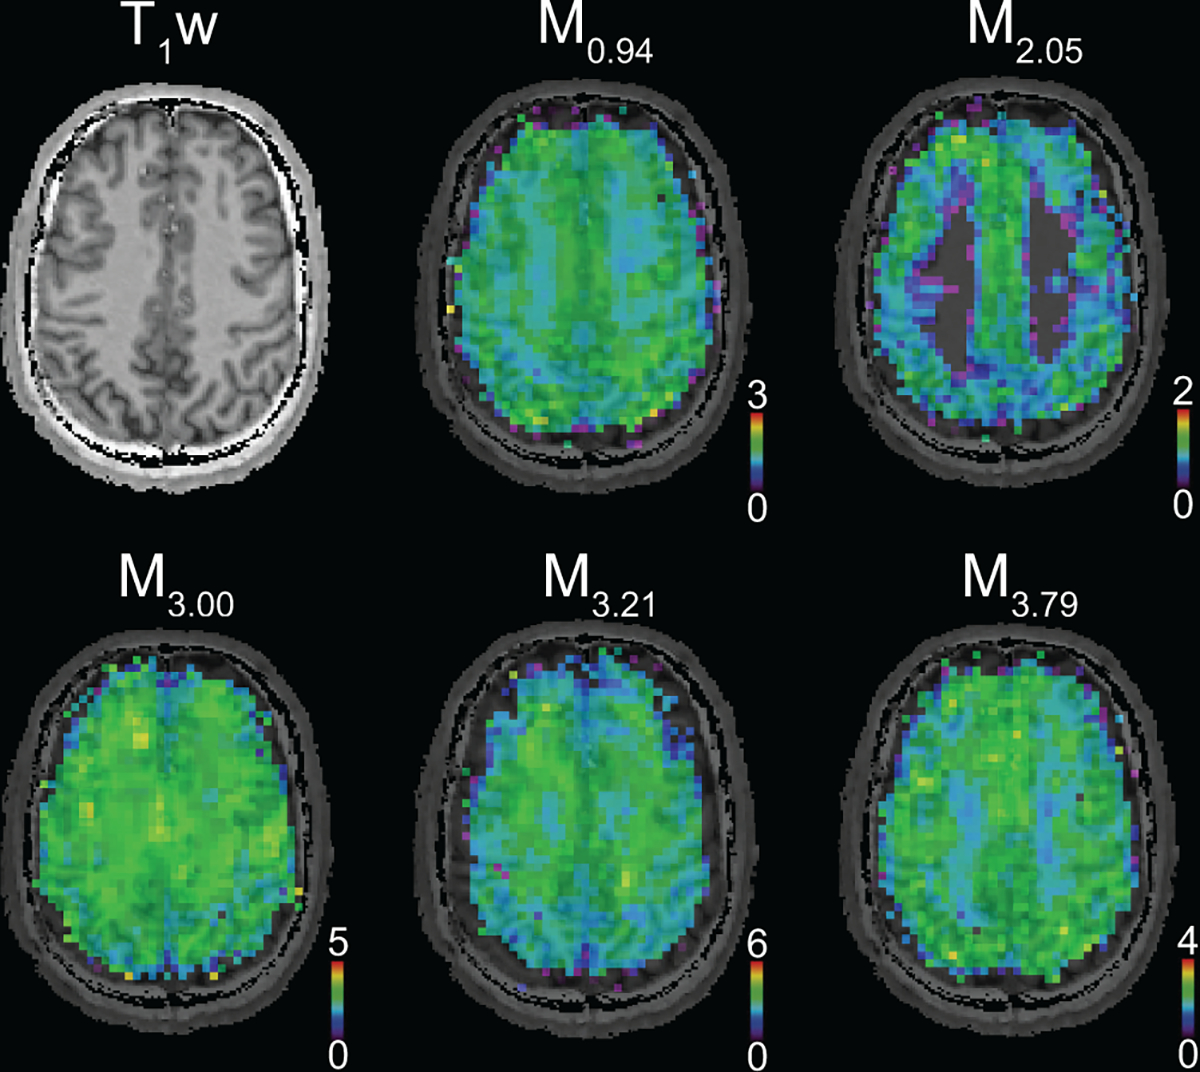
A) T1-weighted MRI and metabolic maps of MM components obtained from a healthy human brain using simultaneous quantification of metabolites and MM from FID-MRSI data. (acquired at 7 T, nominal voxel volume ~0.32 ml51). MM components show regional differences in healthy brain and their signal intensities are typically higher in GM than in WM.