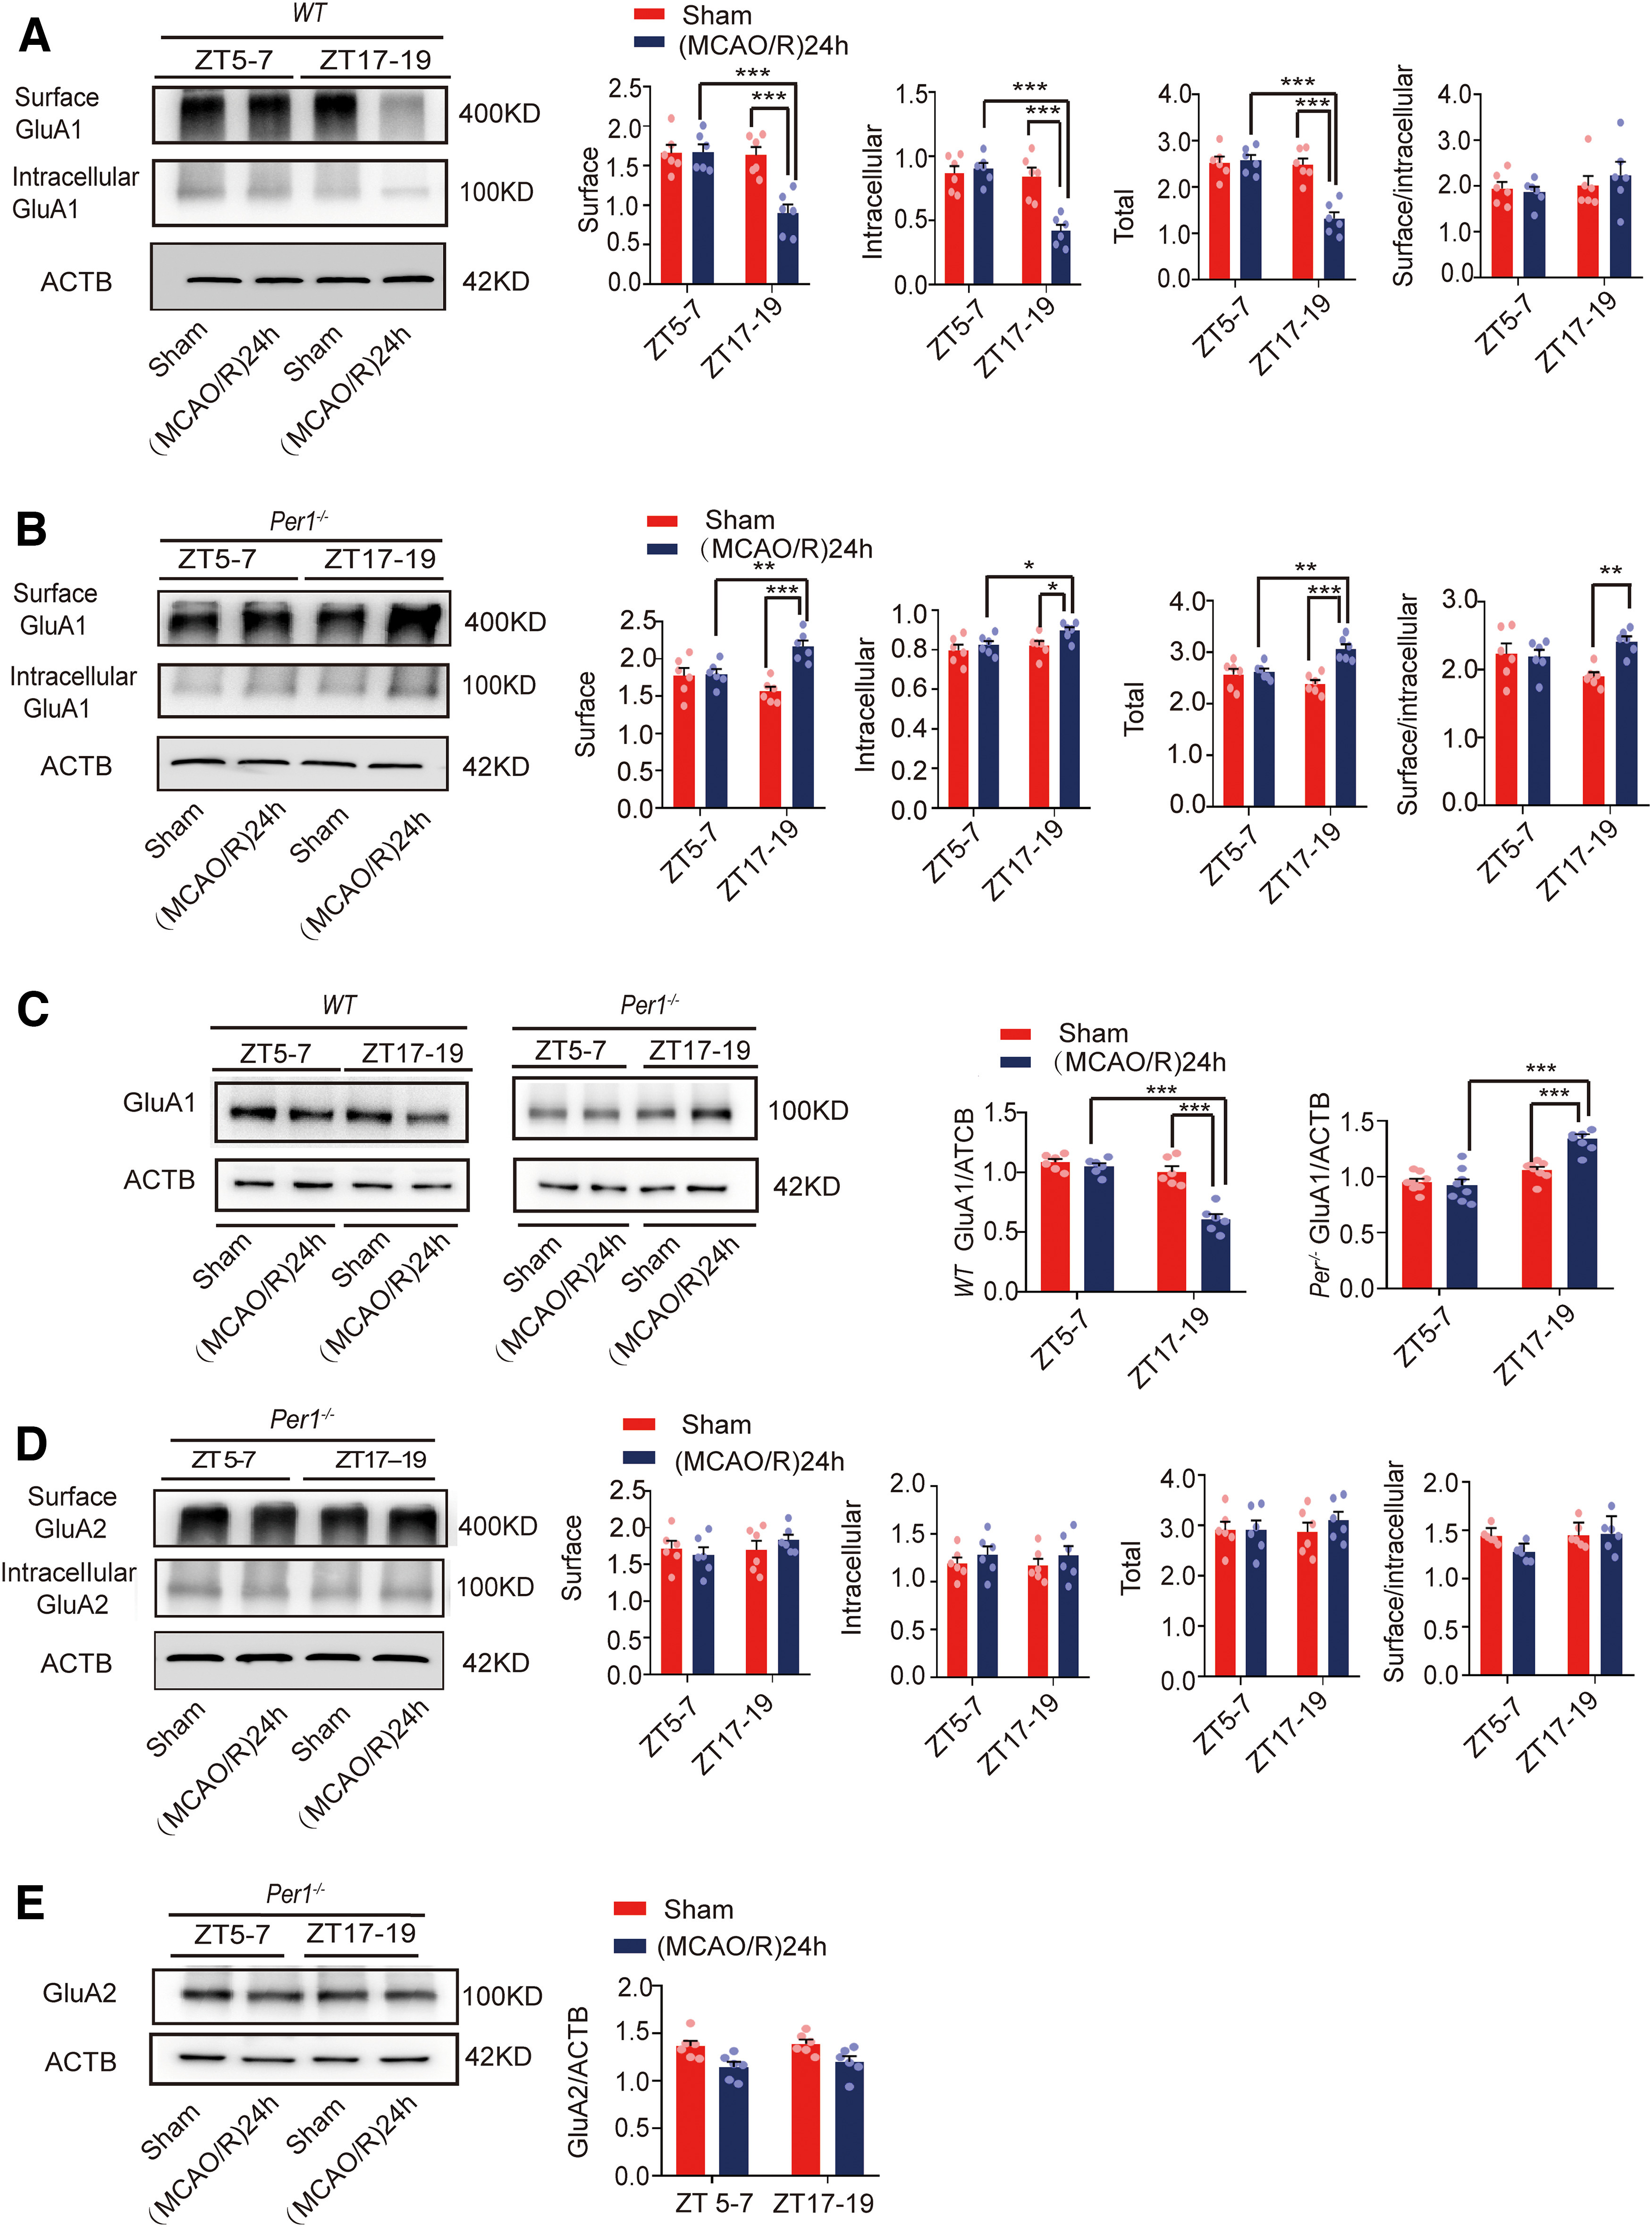
Figure 11.

GluA1/2 expression in penumbra tissue in the (MCAO/R)24 h group in circadian rhythm after Per1 knock-out. A, B, Cell surface, intracellular, and total (surface + intracellular) GluA1 levels and the surface/intracellular ratio in WT and Per1−/−mice at ZT5–ZT7 and ZT17–ZT19 (*p < 0.05, **p < 0.01, ***p < 0.001, n = 6 mice per group). C, Western blot analysis and quantification of GluA1 in Per1−/− and WT mice at ZT5–ZT7 and ZT17–ZT19 (***p < 0.001, n = 6–8 mice per group). D, Cell surface, intracellular, and total (surface + intracellular) GluA2 levels and the surface/intracellular ratio in Per1−/−mice at ZT5–ZT7 and ZT17–ZT19. E, Western blot analysis and quantification of GluA2 in Per1−/− mice at ZT5–ZT7 and ZT17–ZT19. Data are shown as the mean ± SEM.
