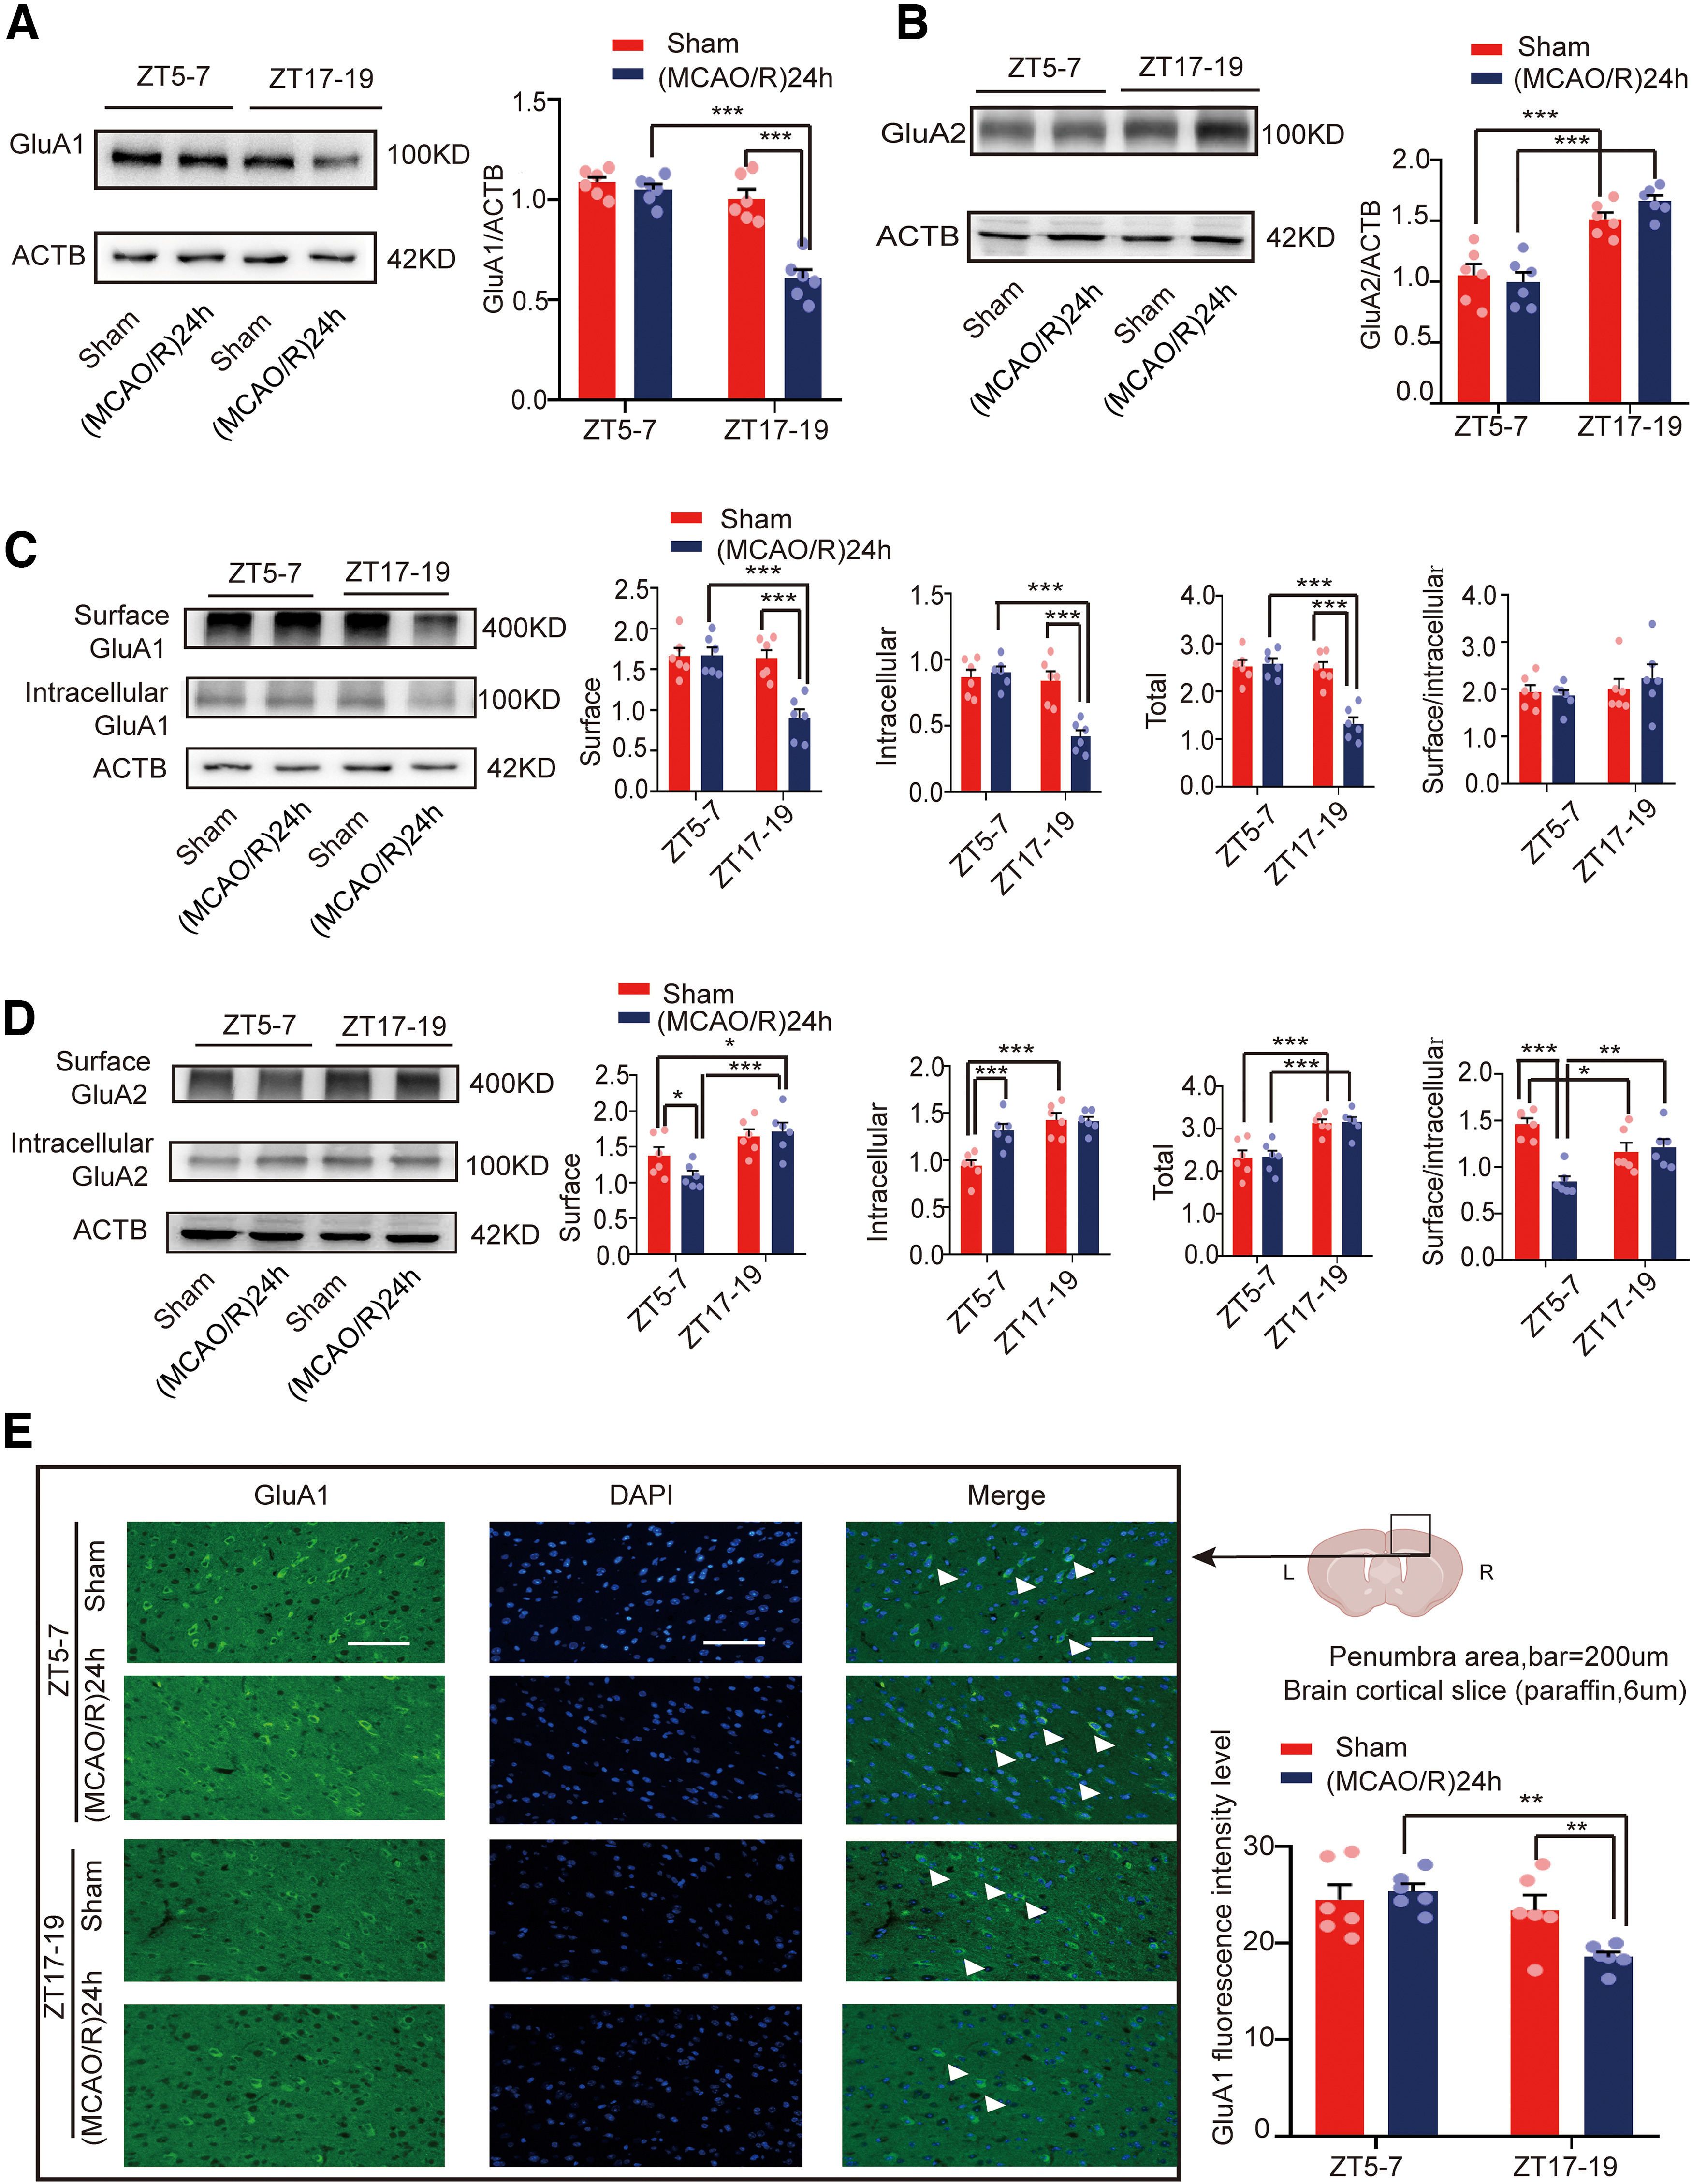
Figure 2.

Mouse brain penumbra GluA1/2 expression in circadian rhythm in the sham and (MCAO/R)24 h groups. A, B, Western blot analysis and quantification of GluA1/2 at ZT5–ZT7 and ZT17–ZT19 in the sham and (MCAO/R)24 h groups (***p < 0.001, n = 6 mice per group). C, Cell surface, intracellular, and total (surface + intracellular) GluA1 levels and the surface/intracellular ratio at ZT5–ZT7 and ZT17–ZT19 (***p < 0.001, n = 6 mice per group). D, Cell surface, intracellular, and total (surface + intracellular) GluA2 levels and the surface/intracellular ratio at ZT5–ZT7 and ZT17–ZT19 (*p < 0.05, **p < 0.01, ***p < 0.001, n = 6 mice per group). E, Immunofluorescence analysis showing that GluA1 expression was significantly decreased in the (MCAO/R)24 h group at ZT17–ZT19 compared with the ZT5–ZT7 (MCAO/R)24 h and ZT17–ZT19 sham groups (**p < 0.01, n = 6 mice per group; scale bar = 200 µm). Data are shown as the mean ± SEM.
