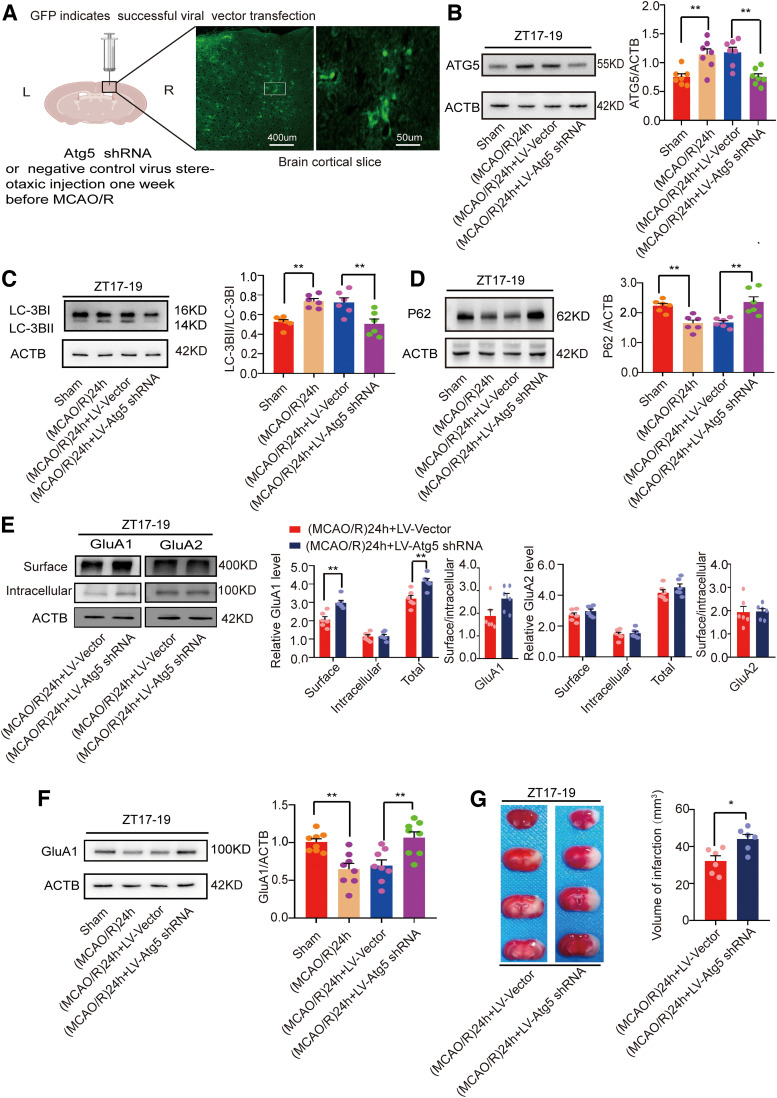
Figure 7.
Mouse brain infarct volume and LC3B, p62, and GluA1/2 expression in penumbra tissue in the (MCAO/R)24 h group at ZT17–ZT19 after Atg5 knock-down. A, One week after LV-Atg5-shRNA or vector was injected into the cortex. Viral flag GFP showed successful injection of the virus (scale bar = 50 and 400 µm). B, Atg5 protein levels were decreased in the LV-Atg5-shRNA group compared with the vector group one week after LV-Atg5-shRNA administration (**p < 0.01, n = 7 mice per group). C, D, Western blot analysis and quantification of LC3BII/LC3BI (**p < 0.01, n = 6 mice per group) and p62 (**p < 0.01, n = 6 mice per group). E, Cell surface, intracellular, and total (surface + intracellular) GluA1/2 levels and surface/intracellular ratios (**p < 0.01, n = 6 mice per group). F, Western blot analysis and quantification of GluA1 expression (**p < 0.01, n = 8 mice per group). G, TTC staining analysis of infarct volume (*p < 0.05, n = 6 mice per group). Data are shown as the mean ± SEM.

