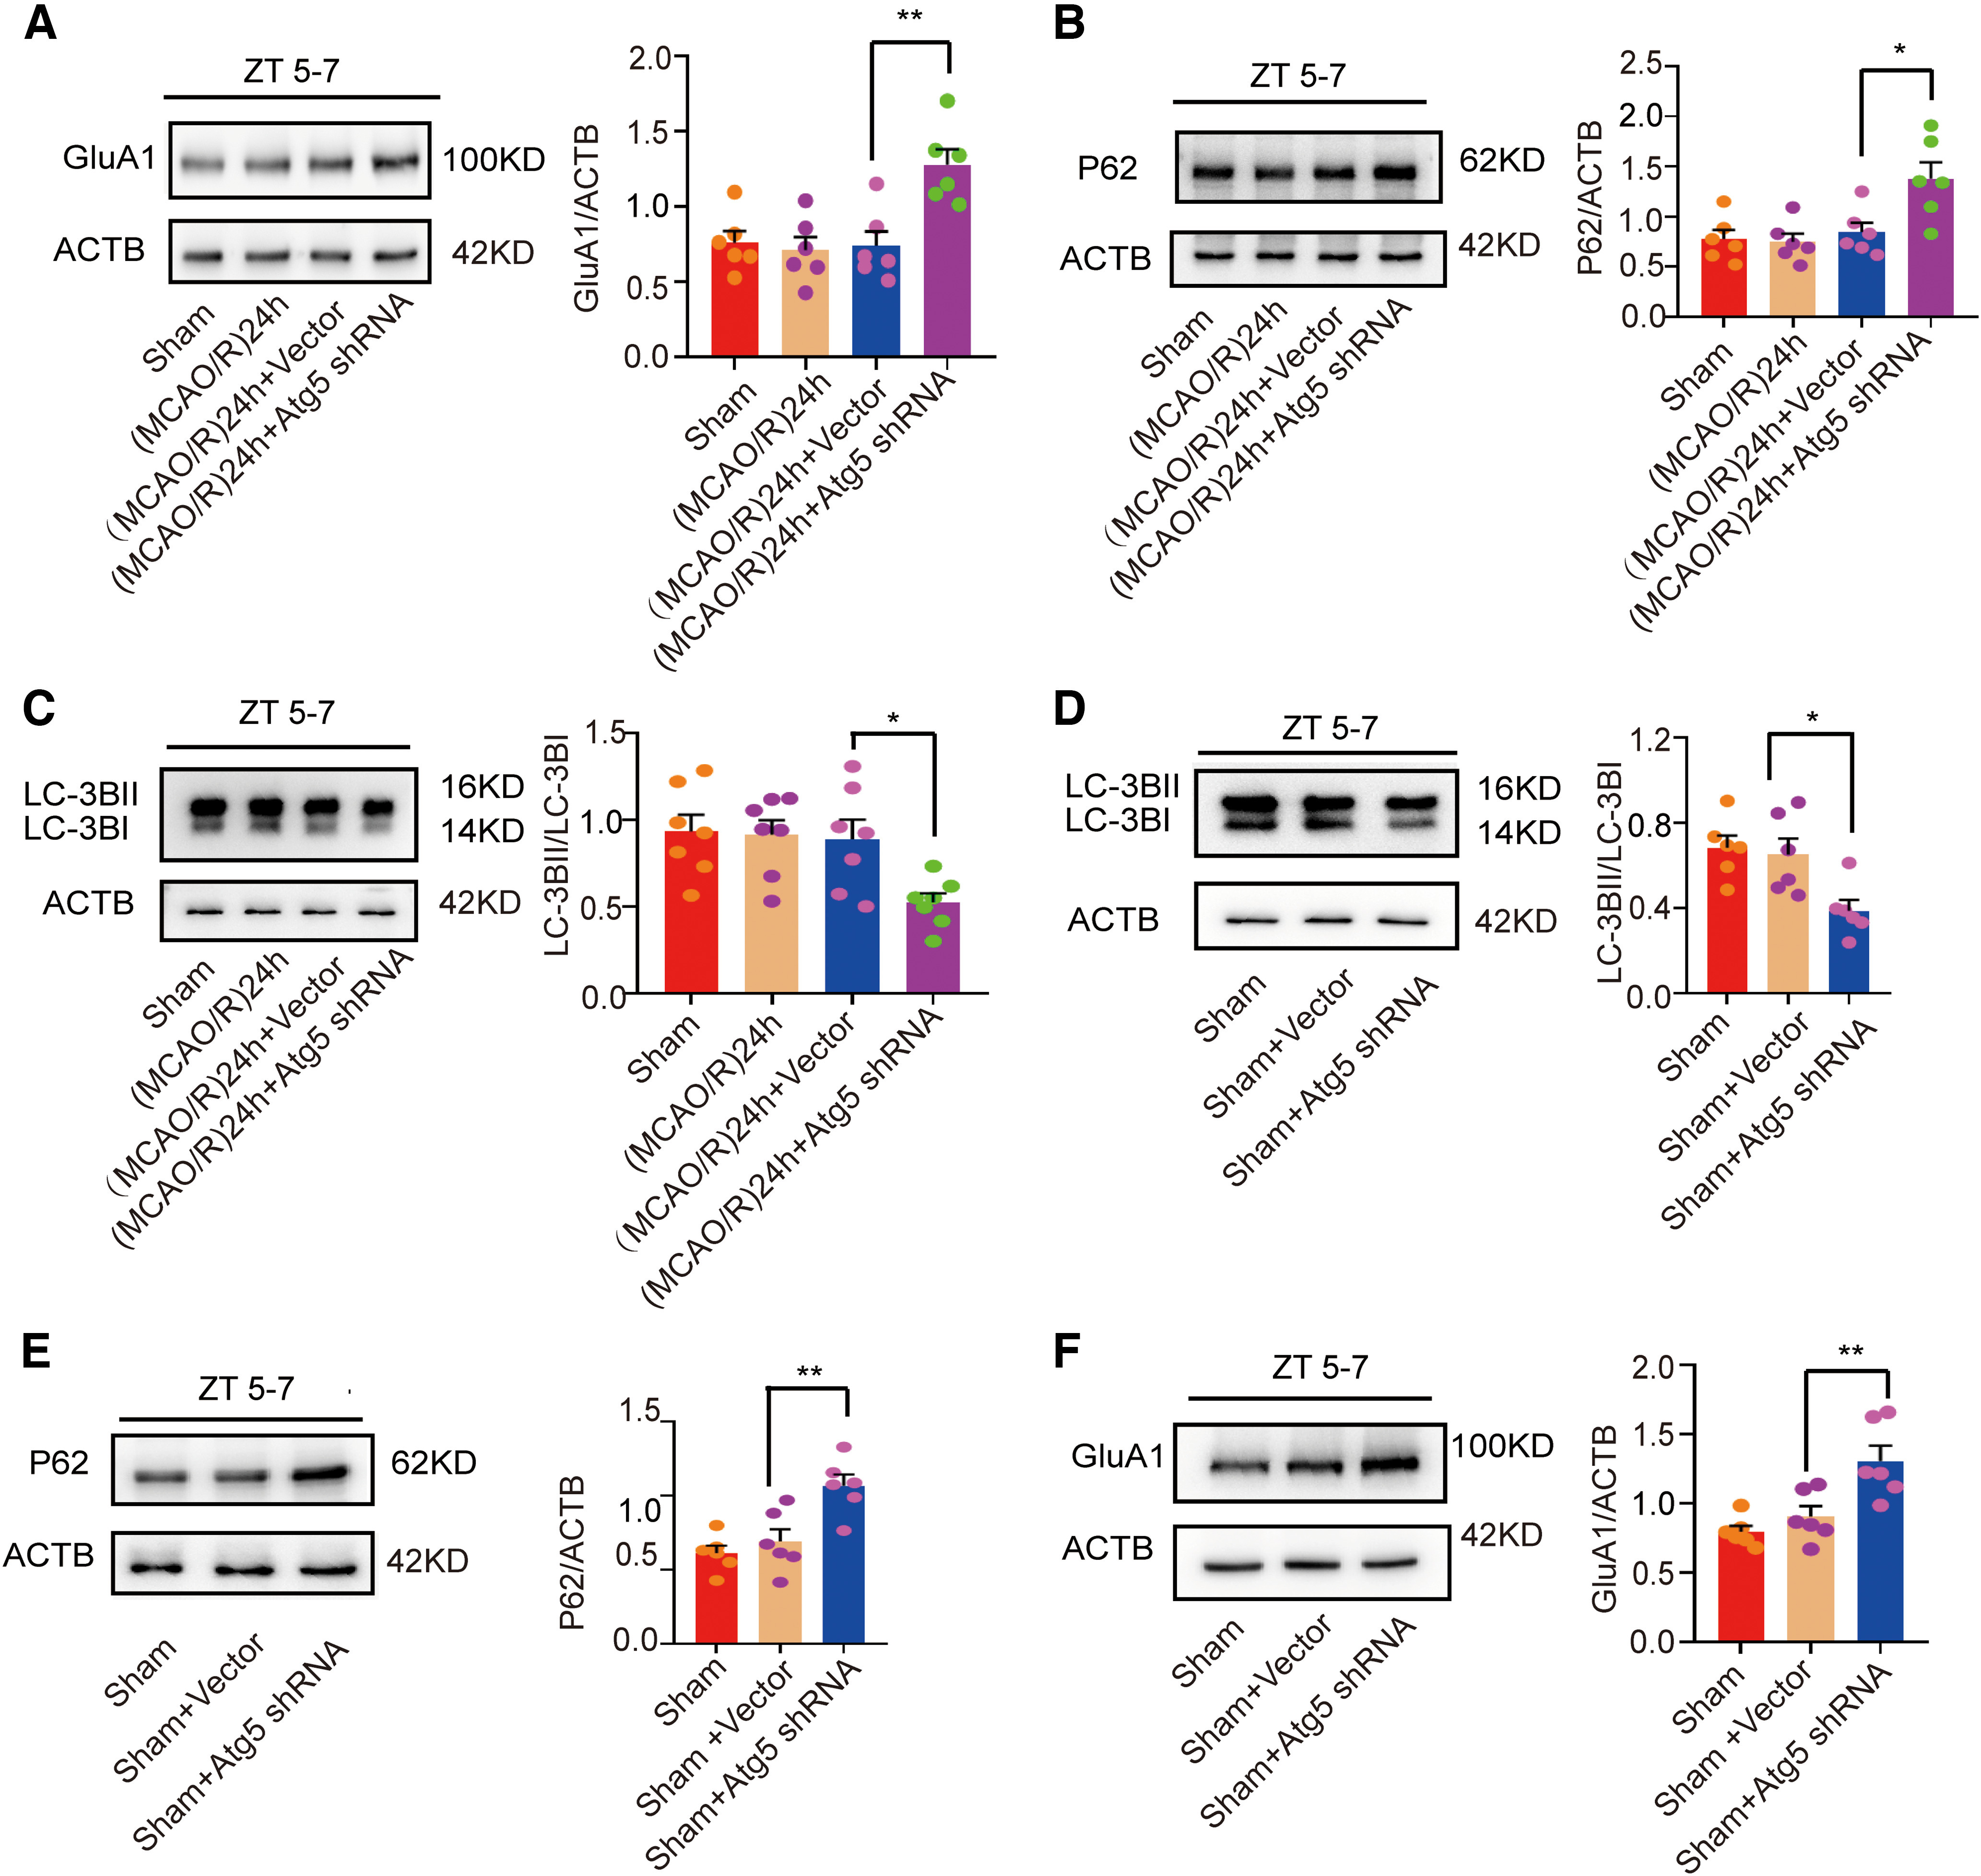
Figure 8.

LC3B, p62, and GluA1 expression after administration of LV-Atg5-shRNA in the (MCAO/R)24 h ZT5–ZT7 group and under nonischemic conditions. A, Western blot analysis and quantification of GluA1 expression in penumbra tissue at ZT5–ZT7 (**p < 0.01, n = 6 mice per group). B, C, Western blot analysis and quantification of p62 (*p < 0.05, n = 6 mice per group) and LC3BII/LC3BI (*p < 0.05, n = 7 mice per group) expression in penumbra tissue at ZT5–ZT7. D, E, Western blot analysis and quantification of LC3BII/LC3BI (*p < 0.05, n = 6 mice per group) and p62 (**p < 0.01, n = 6 mice per group) expression in the sham group. F, Western blot analysis and quantification of GluA1 expression in the sham groups (**p < 0.01, n = 6 mice per group). Data are shown as the mean ± SEM.
