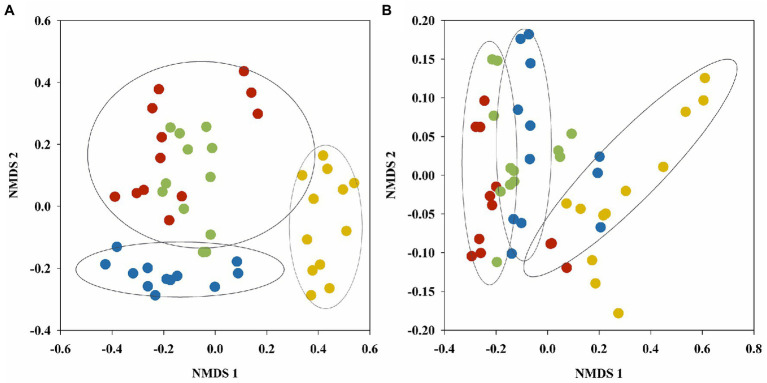
Figure 2.
NMDS plots of fungal (A) and bacterial (B) OTUs found in soil samples of different vegetation types generated using the Bray–Curtis distance matrix. Red, blue, green and yellow dots represent wetlands of B. platyphylla–L. gmelinii, A. sibirica, B. ovalifolia, and C. schmidtii, respectively.

