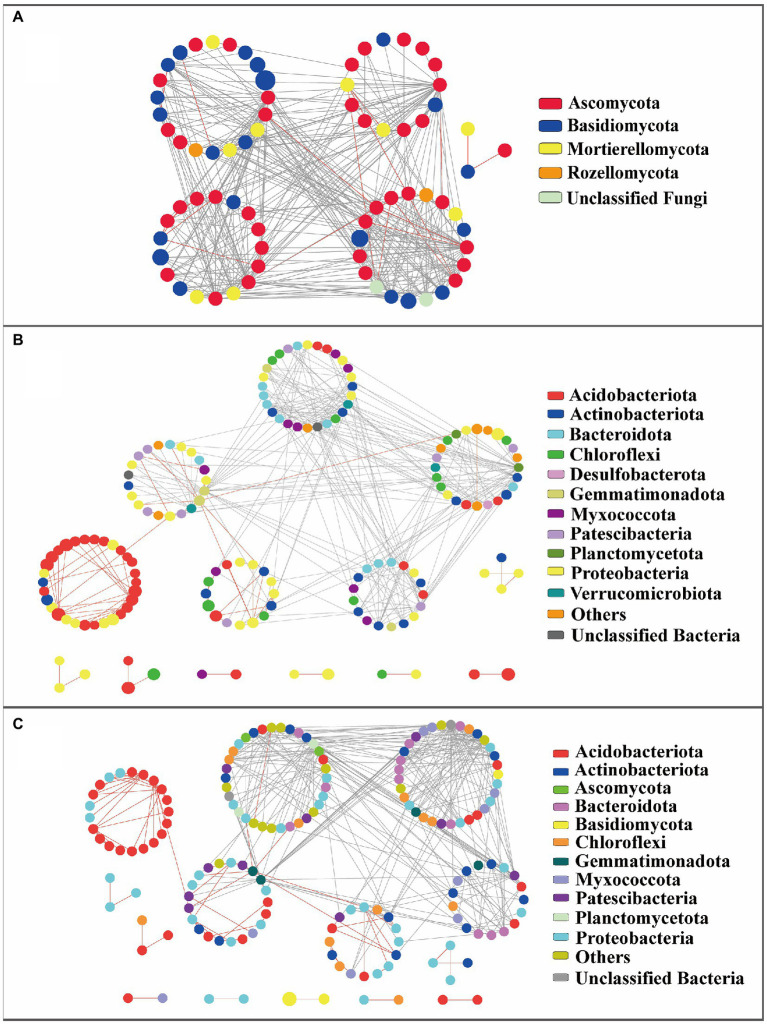
Figure 4.
Network analysis of molecular interactions of fungus-fungus (A), bacterium-bacterium (B), or bacterium-fungus (C) at whole level. The colors of nodes in the webs indicate the taxa represented by the dots. Red lines represent positive interactions, while gray threads are representatives of negative interplay.

