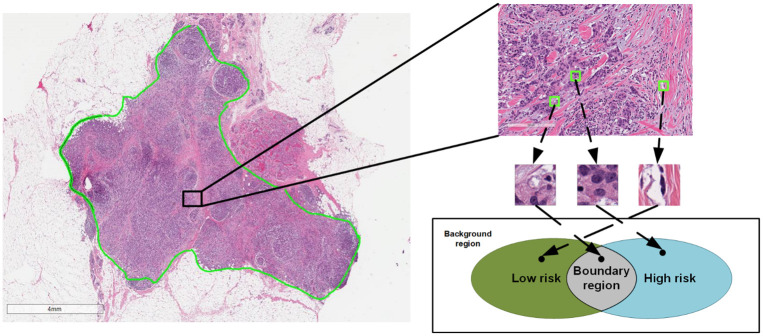
Fig 2. Illustration of the three categories for intelligent sampling.
The image on the left side is a sample slide of our dataset where the tumor region is annotated in green line. Three example patches from an example region (shown as a black rectangle and magnified on the right side) are cropped from this example region (shown in green squares) and belong to different sections of the Venn diagram in the bottom. This Venn diagram demonstrated different implicit categories of patches of the WSI. The discriminative patches in green and blue section of the diagram are patches we want to sample for better slide-level classification.

