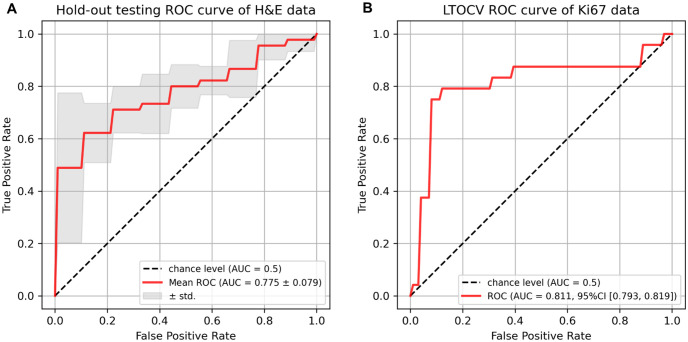
Fig 8. Receiver operating characteristic (ROC) curves of BCR-Net on H&E and Ki67-stained slides.
(a) Hold-out testing ROC curves on H&E-stained slides. The red curve indicates the mean curve based on the five folds’ testing results and the gray shadow indicates the standard deviation. (b) LTOCV ROC curves on the Ki67-stained slides. The red curve indicates the mean curve based on the validation results of the LTOCV.

