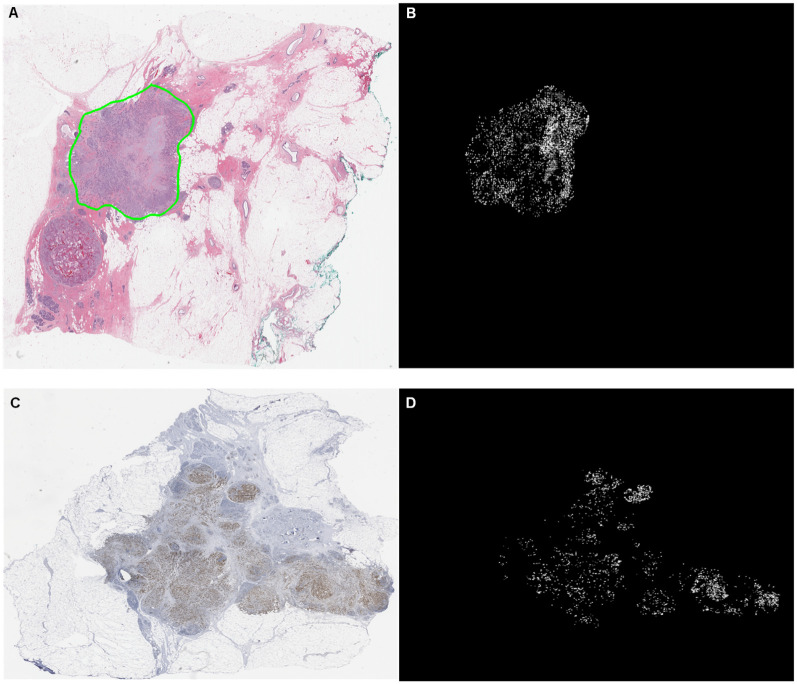
Fig 10. Heatmap visualization of the attention weights yielded by the attention based MIL model.
The top row are a thumbnail and corresponding heatmap of an H&E slide. The bottom row are a thumbnail and corresponding heatmap of a Ki67 slide. The heatmaps are contrast enhanced for visualization purpose. The bright area in the heatmaps correspond to WSI area that receive high attention weights.

