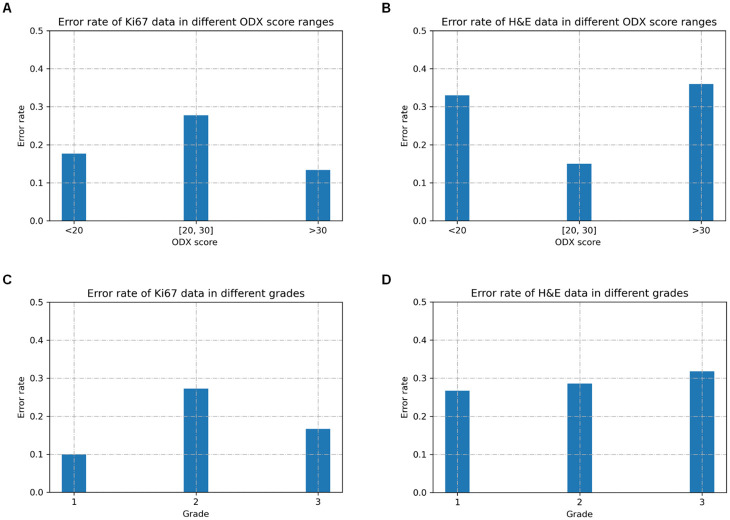
Fig 12. BCR-Net’s validation error rate for patients in different ODX score ranges and grades.
The error rate in a particular group is calculated by dividing the number of misclassified cases in that group by the total number of cases in that group during cross-validation. (a) Error rate resulting from using Ki67 data in different ODX score ranges. (b) Error rate resulting from using H&E data in different ODX score ranges. (c) Error rate resulting from using Ki67 data in different grades. (d) Error rate resulting from using H&E data in different grades.

