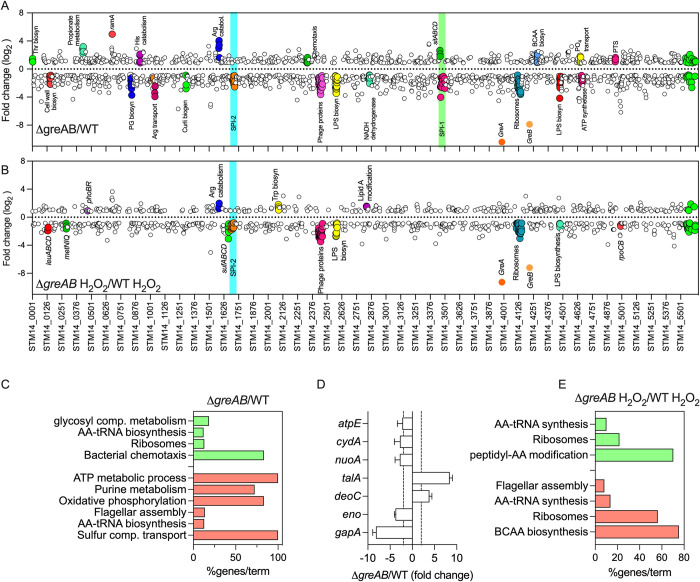
Fig 3. Effect of Gre factors on the transcriptome of Salmonella sustaining oxidative stress.
Fold change values of gene expression in ΔgreAB Salmonella compared to WT controls grown in MOPS-GLC medium (pH 7.2), in the absence (A) or presence (B) of 400 μM H2O2 for 30 min were determined by RNA-seq. Differentially expressed genes were mapped to the location in the chromosome (x axis). Color filled circles represent genetic operons of interest. Genes with a log2 fold change > 0.8 or < -0.8 are depicted on the top and bottom, respectively. Cyan and green boxes represent pathogenicity islands. (C, E) Gene enrichment analysis of differentially expressed genes in A and B was performed by the ClueGO app on cytoscape. Green and red colors represent up-regulated and down-regulated pathways, respectively. (D) Gene expression analysis by qRT-PCR of specimens isolated from WT or ΔgreAB Salmonella grown to an OD600 of 0.25 in MOPS-GLC minimal medium. The data, normalized to the rpoD housekeeping gene, represent the mean ± SD (N = 3). Dashed lines depict the 2-fold up- and down-regulated marks. qRT-PCR, quantitative real-time PCR; WT, wild-type.

