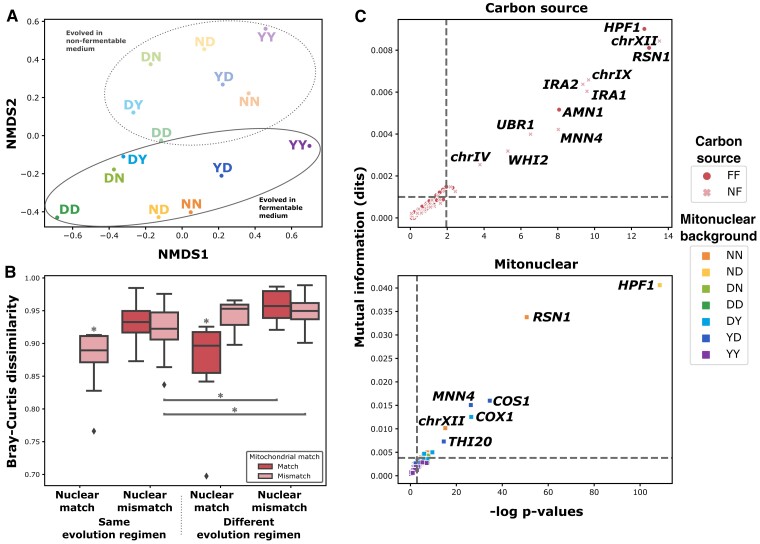
Fig. 4.
Unique evolutionary trajectories are characterized by mitonuclear and carbon source-specific patterns of convergence. (A) Bray–Curtis dissimilarity computed between the mutational profiles (vector of mutation counts at each mutant annotation) of all pairs of mitonuclear backgrounds evolved in each carbon source was used as input for nonparametric multidimensional scaling, revealing their relative differences. (B) Dissimilarity between mutational profiles is high in all conditions but modulated by a shared environment as well as common nuclear and mitochondrial backgrounds (three-way ANOVA P < 0.05). Boxes marked by asterisks (*) indicate evolutionary circumstances associated with significantly lower dissimilarity than all other circumstances (Tukey HSD test P < 0.05). Asterisk (*)-marked connectors indicate pairs of evolutionary circumstances associated with significantly different levels of dissimilarity (Tukey HSD test P < 0.05). (C) Mutant loci were considered specific to a certain carbon source (top) or mitonuclear background (bottom) if their distribution differed significantly from that of all detected mutations, taken as a whole. χ2 tests were performed on contingency tables of all mutations, classifying them as mapping or not to the locus and according to either carbon source or mitonuclear background. Mutual information was calculated from the same contingency tables. Specificity thresholds, indicated by dotted lines, were set at a P value of 0.05, corrected for false-discovery rate, and at two standard deviations above mean (∼95th percentile) mutual information across all loci.

