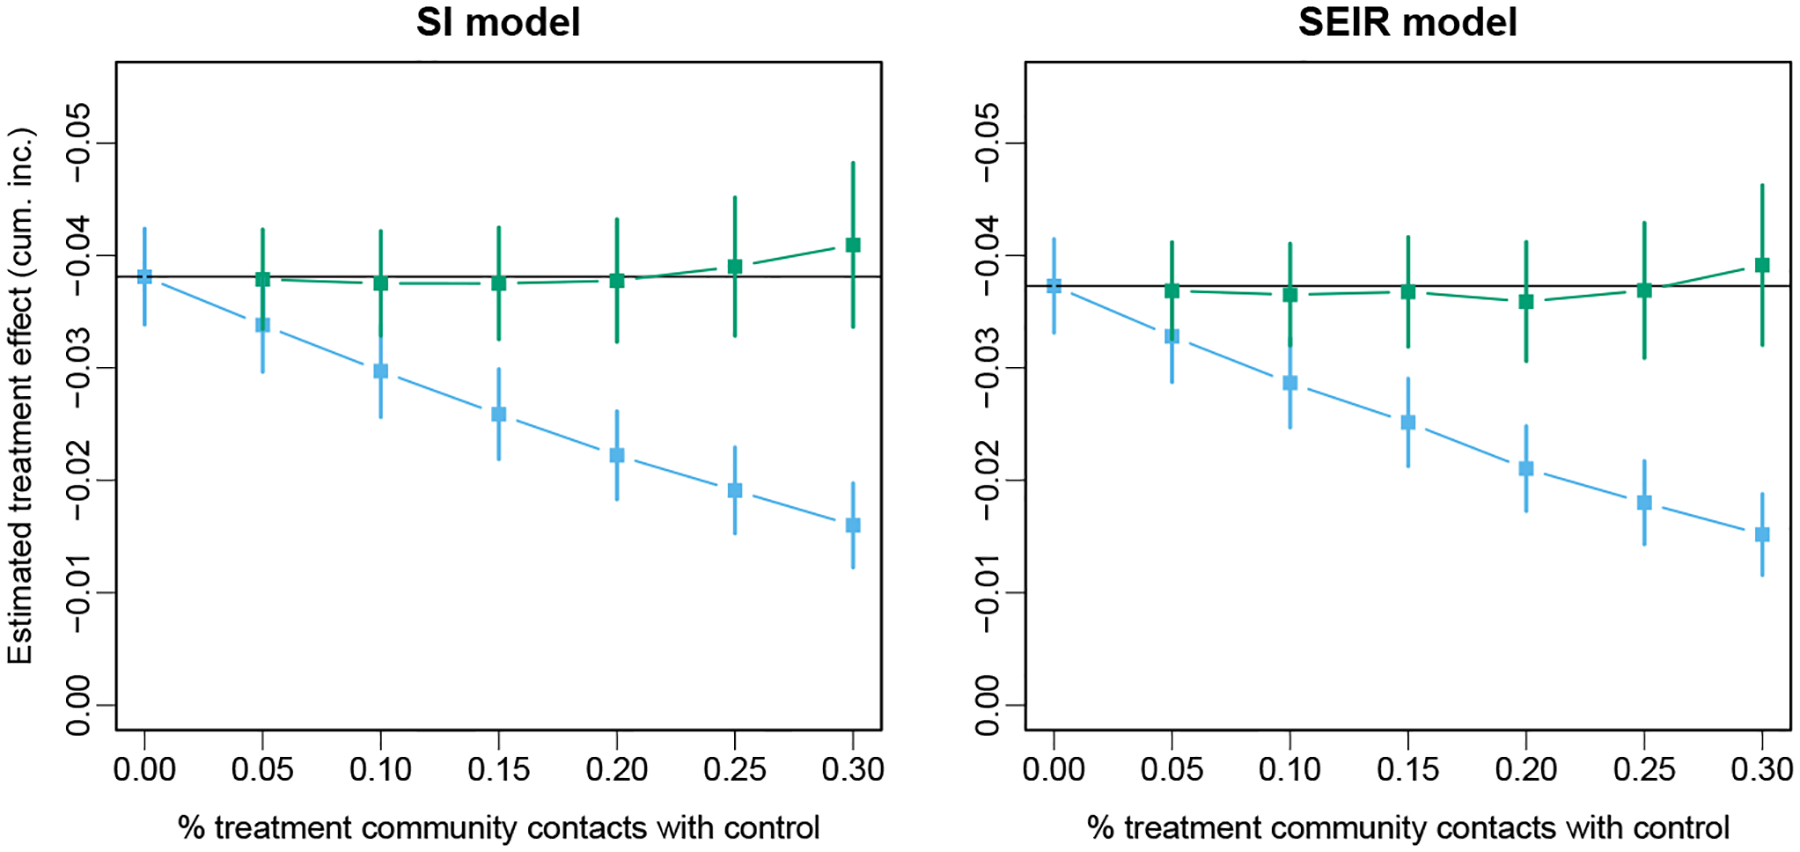
Figure 1: Simulation results from true SI and SEIR epidemic.

Average point estimate and 95% confidence interval for the estimates of randomized and overall treatment effects over 500 simulated data sets with SI and SEIR models. The horizontal black line indicated the expected value of the treatment effect in the absence of interference.
