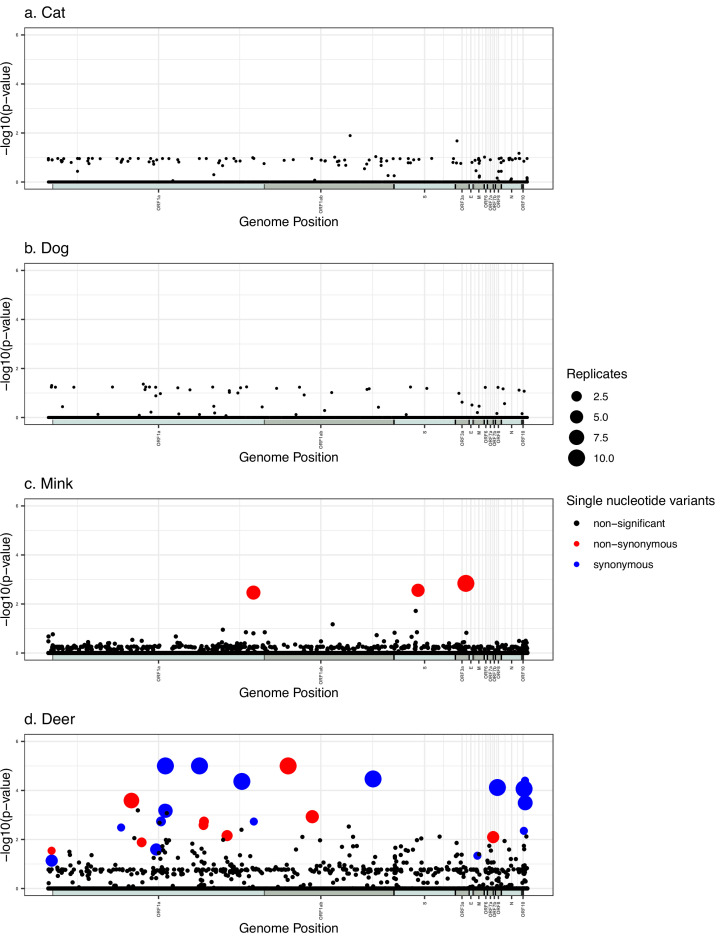
Figure 4. Manhattan plots summarizing genome-wide association studies (GWAS) hits in each animal species.
In every panel, the x-axis represents the nucleotide position in the Severe Acute Respiratory Syndrome Coronavirus 2 (SARS-CoV-2) reference genome and the y-axis represents the -log10 of the pointwise p-values averaged over replicates. ORFs are shown as alternating shaded bars along the x-axis. Statistically, significant hits with family-wise corrected p-values of lower than 0.05 are shown in red (non-synonymous) or blue (synonymous), while non-statistically significant p-values are in black.

