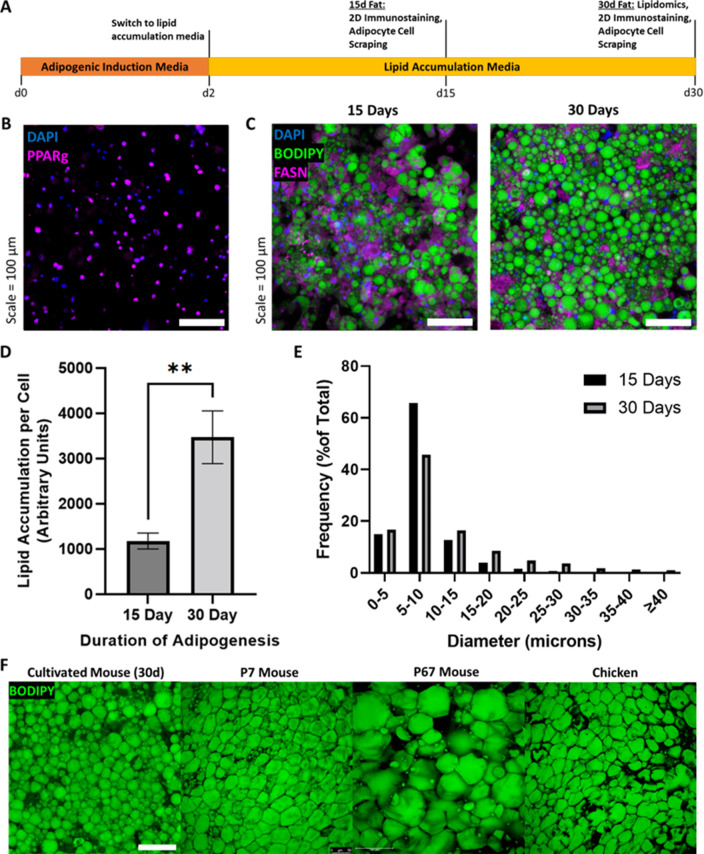
Figure 2. Assessment of in vitro murine adipocyte differentiation.
(A) Timeline of 3T3-L1 adipogenic differentiation. Confluent preadipocytes were grown in adipogenic induction medium for 2 days, then switched to lipid accumulation media for 15 or 30 days, where cells were stained and imaged, or harvested for lipidomics and 3D cultured fat tissue formation. (B) 15-day adipocytes stained for the adipogenic transcription factor peroxisome proliferator-activated receptor gamma (PPARγ) (magenta), as well as nuclei via DAPI (blue). (C) Lipid-stained (BODIPY, green) adipocytes after 15 and 30 days of adipogenesis. The in vitro adipocytes were also stained for DNA via DAPI (blue) and fatty acid synthetase (magenta). (D) The mean degree of lipid accumulation in 15- and 30-day cultured adipocytes, normalized by the number of cells detected via nucleus counting. Sample groups were compared using an unpaired t test with Welch’s correction, where p≤0.01 (**). (E) Frequency distributions of lipid droplet diameters from cultured adipocytes adipogenically grown for 15 and 30 days, compared via chi-square test in Supplementary file 2. (D) represents n=4 technical replicates from one experiment, while (E) represents n=4 technical replicates from a second experiment. (F) Lipid staining images (BODIPY) of 30-day in vitro 3T3-L1s compared to native adipocytes from chicken and mice of two ages. ‘7D Mouse’ and ‘67D Mouse’ refer to 7- and 67-day-old mice, respectively. Scale bar (same for all images) represents 100 µm.

