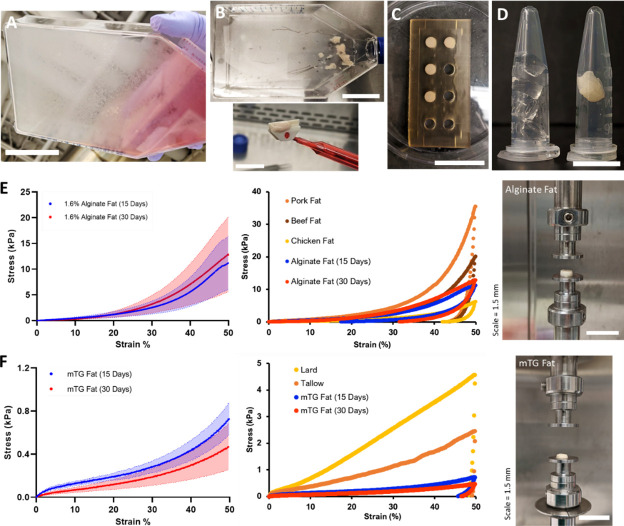
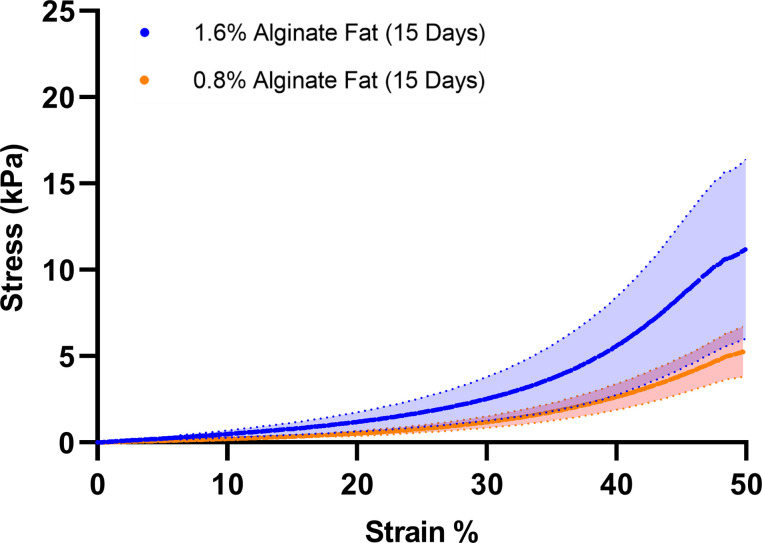
Figure 3. Mechanical characterization of 3D cultured fat tissues.
(A–D) Steps for producing 3D macroscale cultured fat tissues through the aggregation of individual adipocytes grown in vitro. (A) Adipogenesis: Adipocytes were differentiated in vitro for 15–30 days. Lipid-accumulating fat cells turned the bottom of the cell culture flask opaque. Scale bar 5 cm. (B) Cell harvest: Adipocytes were mechanically collected with a cell scraper, which aggregated the cells into masses of cultured fat. Scale bars 5 and 1.5 cm for the top and bottom images, respectively. (C) Binding into 3D tissue: Harvested fat was combined with a binder (e.g., alginate, transglutaminase) in a mold to add structure. Scale bar 3 cm. (D) 3D cultured fat: Cylinders of structured cultured fat tissue after removal from the mold. A piece of 3D cultured fat tissue made with 1.6% alginate is shown in the right tube, while the left tube contains 1.6% alginate without fat cells. Scale bar 1 cm. (E and F) Mechanical testing of cultured and native fat tissues (uniaxial compression). (E, i) shows the compressive strength of alginate-based cultured fat tissues formed using 15- or 30-day adipocytes, while (F, i) shows the same for microbial transglutaminase (mTG)-based cultured fat tissues. Solid lines represent mean values, while the shaded areas represent standard deviations. (E, ii) A compressive strength comparison of alginate-based cultured fat tissues with intact pig, cow, and chicken adipose tissues. Data points represent mean values, and the overall data represent tissue loading from 0% to 50% strain over 30 s, followed by unloading to 0% strain over the same duration. (F, ii) The same compressive strength comparison as (E, ii) but with mTG fat tissues alongside rendered animal fats from pigs (lard) and cows (tallow). (E, iii) depicts macroscale alginate-based cultured fat tissues on the mechanical testing apparatus prior to compression. (F, iii) depicts the same for mTG-based cultured fat tissues. n=4 for all alginate-based cultured fat constructs. n=3 and 5 for 15- and 30-day mTG cultured fat constructs, respectively. n=5, 6, 7 for beef, pork, and chicken adipose samples respectively. n=4 for lard and tallow samples respectively. All ‘n’ values refer to technical replicates.

