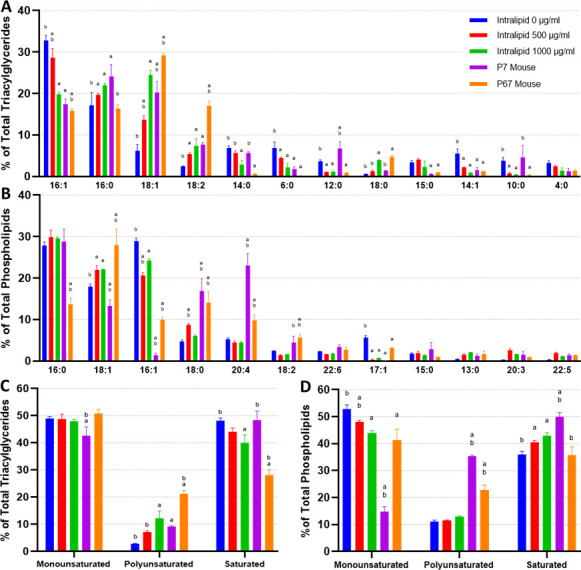
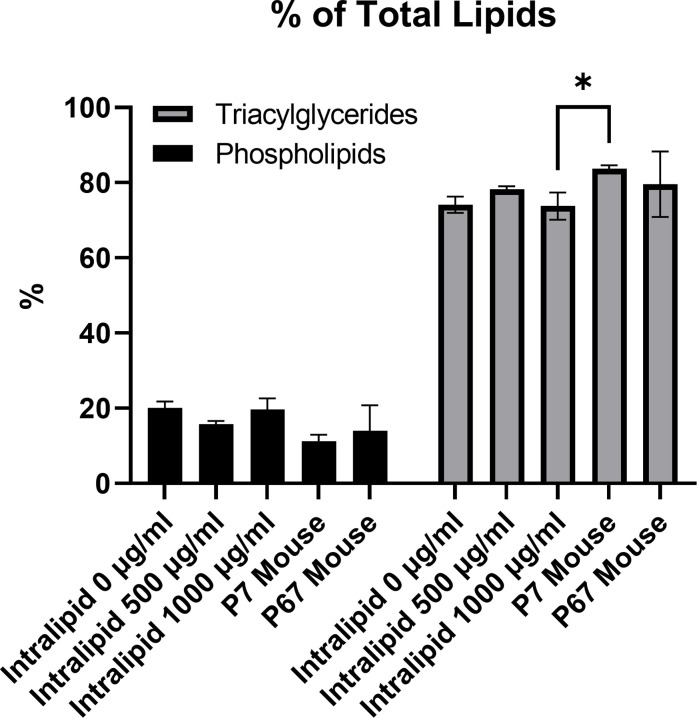
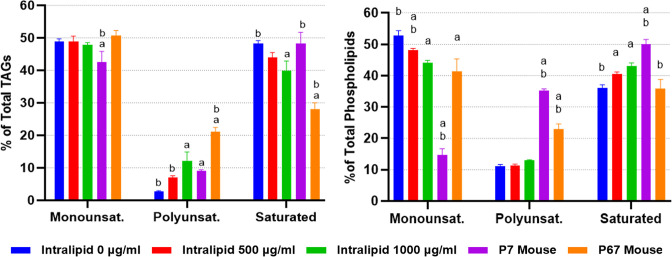
Figure 4. Lipidomics analysis of fatty acid compositions in cultured murine adipocytes.
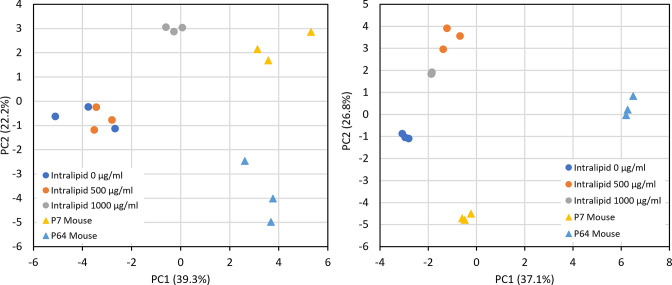
(A, B) The fatty acid (FA) composition of (A) triacylglycerides (TAGs) and (B) phospholipids from in vitro (30 days of adipogenesis, 0–1000 µg/ml Intralipid) and native murine fats. The stacked graphs on the left illustrate the overall FA composition within each sample group (top 6 FAs color coded). The top-down order of FAs shown are the same in the graph and the legend. The column graphs on the right show the top 8 most prevalent FAs across all the sample groups with error bars (SD). The top-down order in the legend is the same as the left-right order of the samples in the column charts. Tables containing the proportions of all detected FAs, as well as principal component analysis (PCA) graphs, are available (Supplementary files 4 and 5; Figure 4—figure supplement 1). (C, D) FA compositions categorized by degree of saturation are shown for (C) TAGs and (D) phospholipids. The top-down order of monounsaturated (monounsat.), polyunsaturated (polyunsat.), and saturated FAs are the same in the graph and the legend. Column graphs of (C) and (D) with p≤0.05 comparisons are available in Figure 4—figure supplement 3. (E) The 18:3 (TAG fraction) content of 3T3-L1 adipocytes adipogenically cultured for 30 days with various levels of fatty acid (Intralipid) supplementation, versus native mouse fat samples. For all column graphs, ‘a’ and ‘b’ represent a difference of p≤0.05 versus 0 µg/ml Intralipid and 1000 µg/ml Intralipid, respectively (analysis of variance [ANOVA] with Tukey’s post-hoc tests). ‘IN-0’, ‘IN-500’, ‘IN-1000’ stand for Intralipid 0, 500, 1000 µg/ml Intralipid, respectively. ‘7D Mouse’ and ‘7M’ represent 7-day-old mouse adipose, while ‘67D Mouse’ and ‘67M’ represent 67-day-old mouse adipose. n=3 (technical) for all sample groups.


