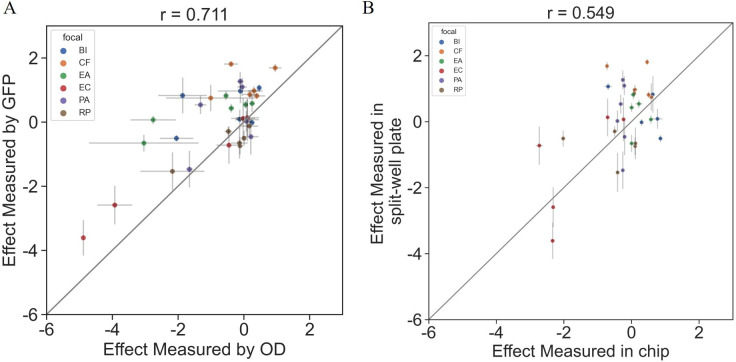
Appendix 1—figure 1. Interactions measured with OD600 are consistent with those based on fluorescent measurements.
The effects of six single species on each focal were measured using OD600 and fluorescence in a 96 split well plate (see ‘Materials and methods’). (A) The correlation between the effect when measured by fluorescence and OD600 (p=1e-6). (B) The correlation between the effect when measured in the kChip and the HTD Equilibrium Dialysis System (p=0.001). Each point represents the median effect of three techinacal repliactes, and error bars represent the standard error calculated viabootstraping (see ‘Materials and methods’).

