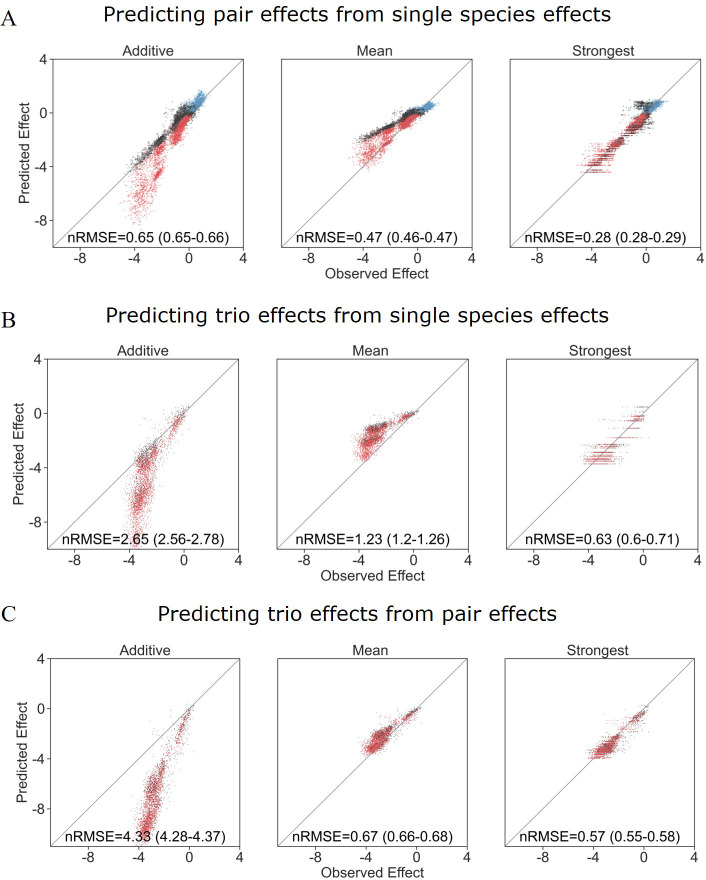
Appendix 1—figure 3. Different models prediction accuracy using all measured effects, not filtered for affecting species autofluorescence.
Correlation between three different models for how (A) single-species effects combine to pairs, (B) single-species effects combine into trio effects, and (C) pairwise species effects combine into trio effects, and the experimental data. Root squared mean error normalized (nRMSE) to the interquartile range. nRMSE values are calculated from 1000 datasets and represent the median and interquartile range in parentheses (see ‘Materials and methods’).

