. 2023 Feb 28;12:e83398. doi: 10.7554/eLife.83398

Figure 1. Measuring effects of 61 affecting species, and their pairs and trios on 6 focal species.

(A) A library of 61 soil and leaf-associated bacterial strains was used in this experiment. All strains are from four orders: Proteobacteria (orange), Firmicutes (blue), Bacteroidetes (purple), and Actinobacteria (green) (full list in Supplementary file 1a, Source data 1). Also, 6 of the 61 species were labeled with GFP and used as ‘focal’ species whose growth was tested in the presence of the other isolates (affecting species). These strains are labeled on the phylogenetic tree (Escherichia coli [EC], Ewingella americana [EA], Raoultella planticola [RP], Buttiauxella izardii [BI], Citrobacter freundii [CF], and Pantoea agglomerans [PA].) (B) Each focal species was grown in monoculture, with (between 18 and 52) single affecting species, and (between 153 and 1464) pairs of affecting species. Additionally, E. coli was grown with 3009 trios of affecting species. (C) Effects of pairs and trios were then predicted using the effects of single species and single species and pairs, respectively. Predictions were made using three different models: additive, mean, and strongest (detailed in ‘Results’ and ‘Materials and methods’). (D) Equation used for calculating the effect of an affecting species on the focal species.

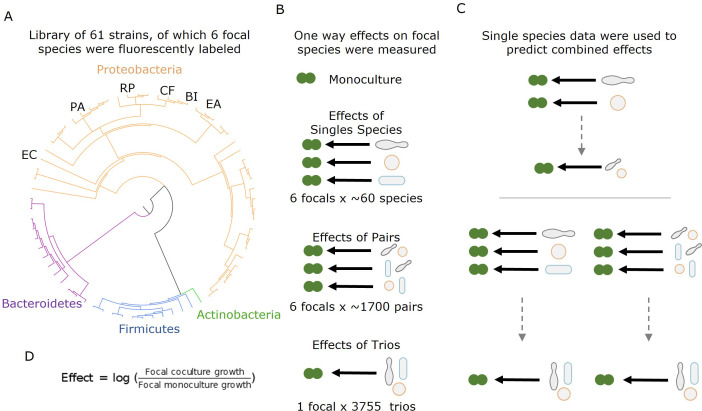
Figure 1.

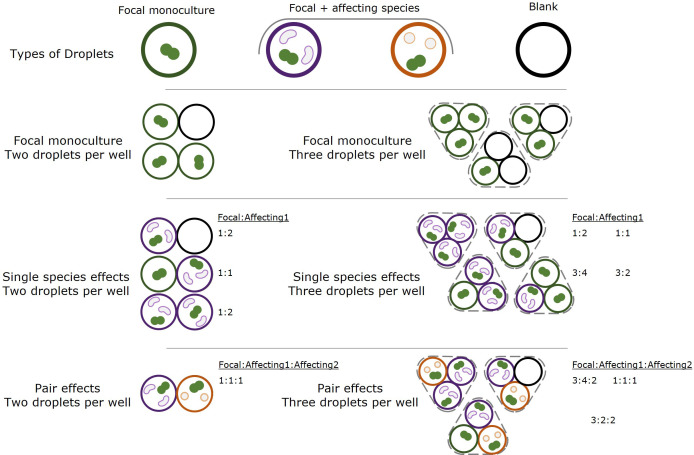
Figure 1—figure supplement 1. Species in each droplet and well in kChip experiments.

Figure 1—figure supplement 1.

Droplets contained one of three different types of samples: (1) focal monoculture, containing only the focal species, (2) coculture of focal species and a single affecting species at an optical densities ratio of 2:1, and (3) blank samples, with media but no bacterial cells. Based on which two or three droplets (depending on the experimental setup) each well contained either a focal monoculture, one, two or three, affecting species. Similar communities started at different initial densities based on how many monoculture or blank droplets were in the well, but as shown in Figure 1—figure supplement 2, initial densities did not influence the effect on the focal. Ratios of focal species to affecting species 1 and 2 are detailed for different well setups.

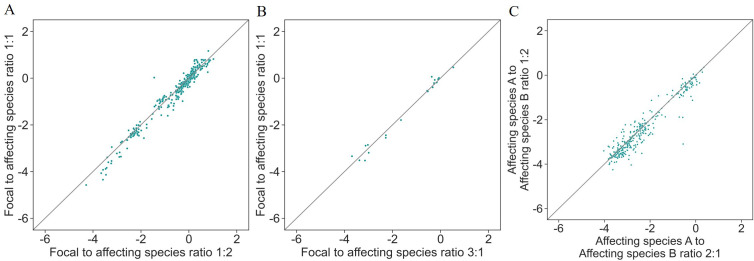
Figure 1—figure supplement 2. Effects on focal species are independent of initial species' density.

Figure 1—figure supplement 2.

Correlation between different ratios of initial optical density in each well. (A) Different ratios of focal to affecting species based on whether there were two droplets containing the affecting species or one and one focal monoculture droplet: nRMSE = 0.22. (B) Different ratios of focal to affecting species based on whether there were three droplets containing the affecting species or one and two focal monoculture droplets: nRMSE = 0.16. (C) Different ratios of affecting species based on whether there were two droplets containing affecting species A and one droplet containing affecting species B or vice versa: nRMSE = 0.24.

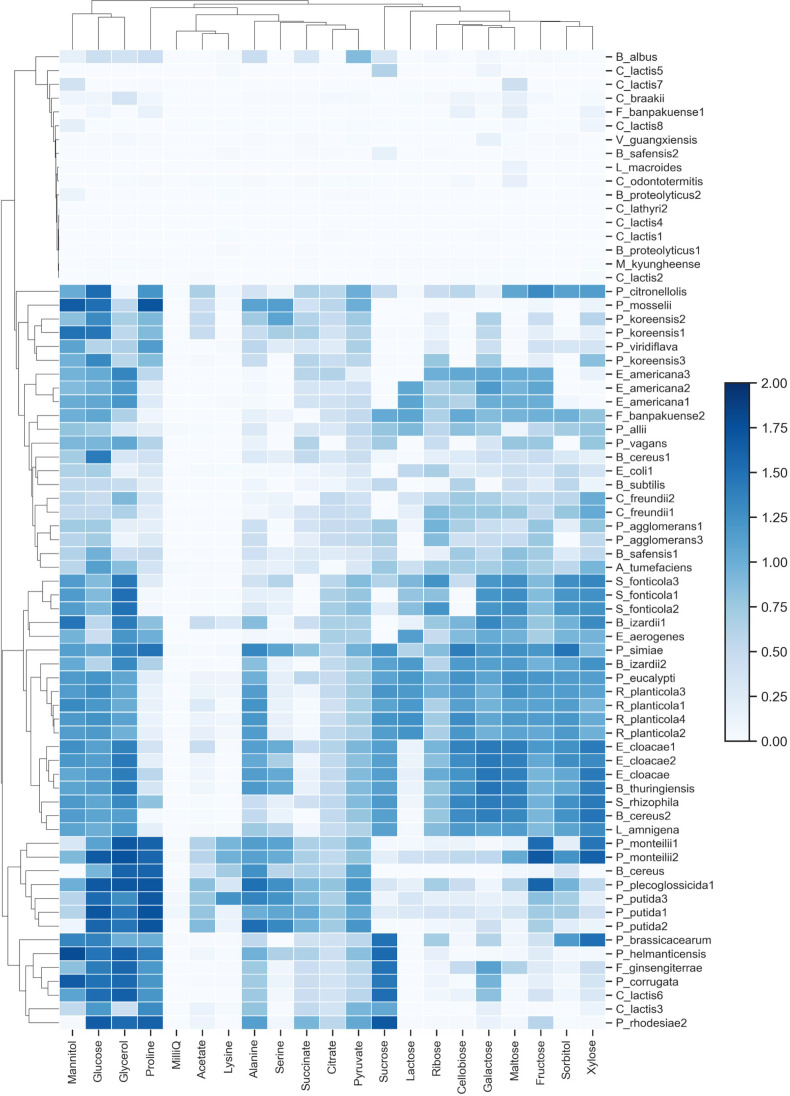
Figure 1—figure supplement 3. Carbon source utilization profiles for bacterial strains.

Figure 1—figure supplement 3.

Each strain’s yield on 20 different carbon sources, assayed after 48 hr. Growth values are calculated as mean OD600 measurement from three replicates and were background-subtracted (media with no bacteria).

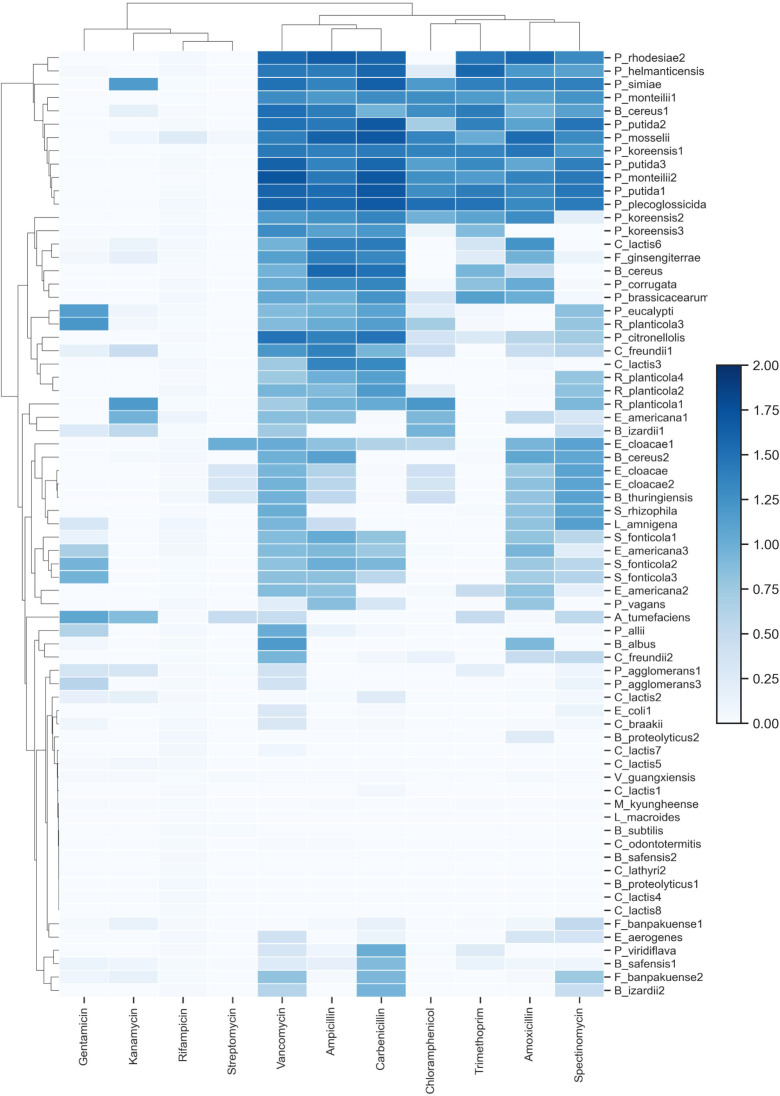
Figure 1—figure supplement 4. Antibiotic resistance profiles for bacterial strains.

Figure 1—figure supplement 4.

Each strain’s ability to grow on 11 different antibiotics after 48 hr. Growth values are calculated as mean OD600 measurement from three replicates and were background-subtracted (media with no bacteria).

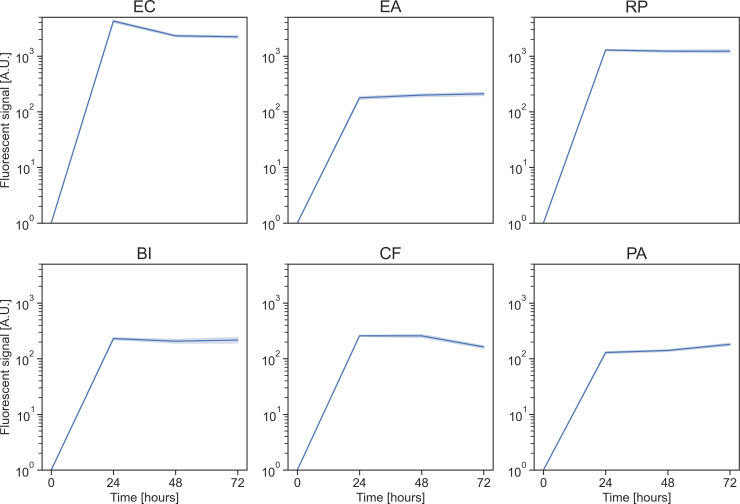
Figure 1—figure supplement 5. Growth dynamics of focal species in monoculture.

Figure 1—figure supplement 5.

Growth in kChip of each focal strain in monoculture over 72 hr. Growth is measured by fluorescent signal and each well is normalized to the value at the beginning of the experiment (all signals at time zero are equal to one). The solid line represents the mean, and the shaded area the 95% confidence interval.