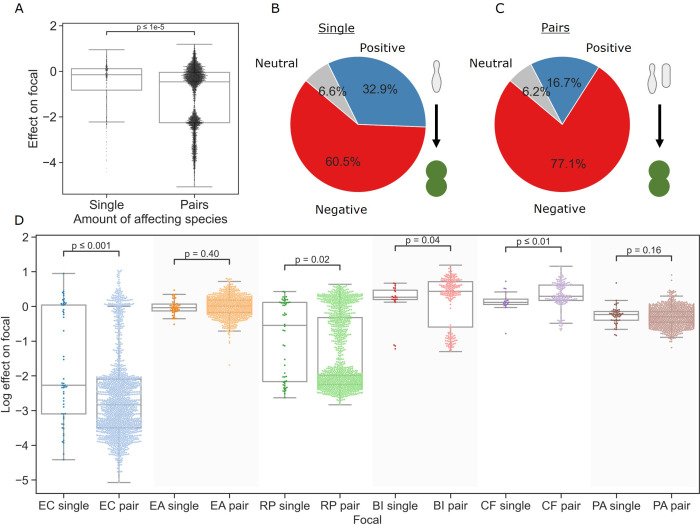
Figure 2. Pairs of affecting species have stronger effects than single species.
(A) Distribution of the effects of single and pairs of affecting species on all focal species. Mann–Whitney–Wilcoxon test two-sided, p-value = 1e-9. Dots show individual effects, solid lines represent the median, boxes represent the interquartile range, and whiskers are expanded to include values no further than 1.5× interquartile range. (B, C) Distribution of qualitative effects of single and pairs of affecting species respectively on all focal species. (D) Distribution of the effect of single and pairs of affecting species for each focal species individually. Dots represent individual measurements, solid lines represent the median, boxes represent the interquartile range, and whiskers are expanded to include values no further than 1.5× interquartile range. Mann–Whitney–Wilcoxon test two-sided tests were performed for each focal species, and p-values are shown on the graph.


