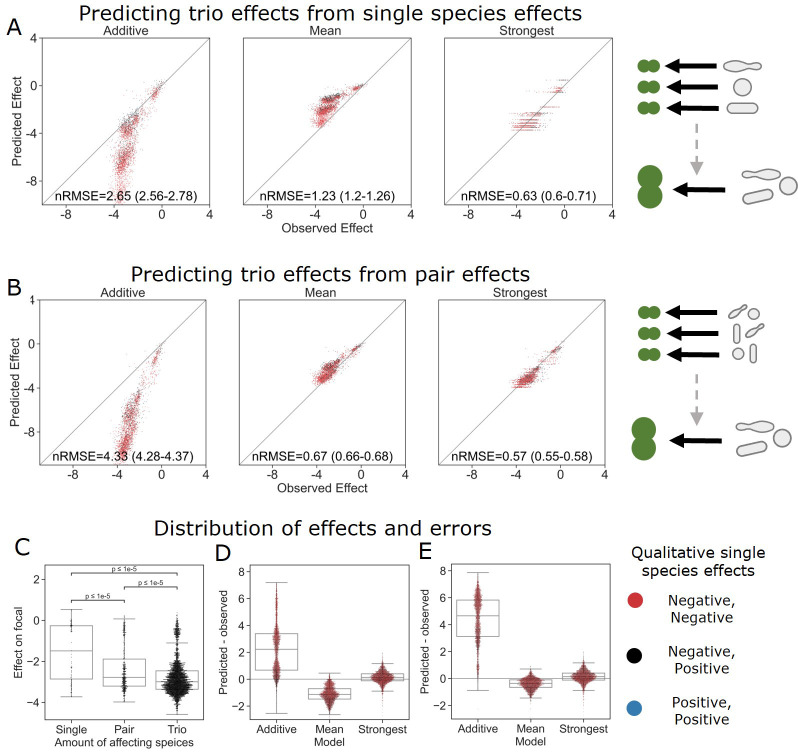
Figure 4. The strongest effect model is also the most accurate for trios.
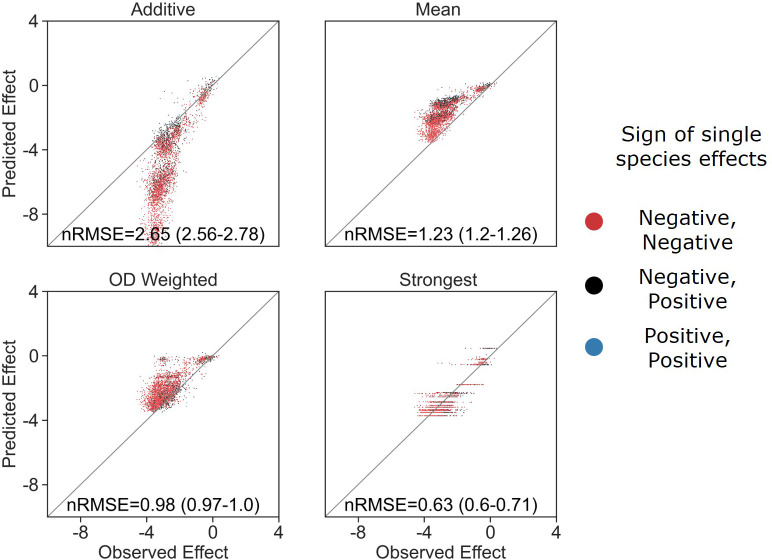
(A, B) Correlation between three different models for how (A) single-species effects and (B) pairwise species effects combine into trio effects, and the experimental data. Root squared mean error normalized (nRMSE) to the interquartile range. nRMSE values are calculated from 1000 datasets and represent the median and interquartile range in parentheses (see ‘Materials and methods’). (C) Distribution of the effects of single, pairs, and trios of affecting species on E. coli. All Mann–Whitney–Wilcoxon two-sided tests were significant, p values are shown on plot. Dots show individual effects, solid lines represent the median, boxes represent the interquartile range, and whiskers are expanded to include values no further than 1.5× interquartile range. (D, E) Distribution of errors for each model based on (D) single-species data and (E) pairs data. Dots show individual effects, solid lines represent the median, boxes represent the interquartile range, and whiskers are expanded to include values no further than 1.5× interquartile range.


