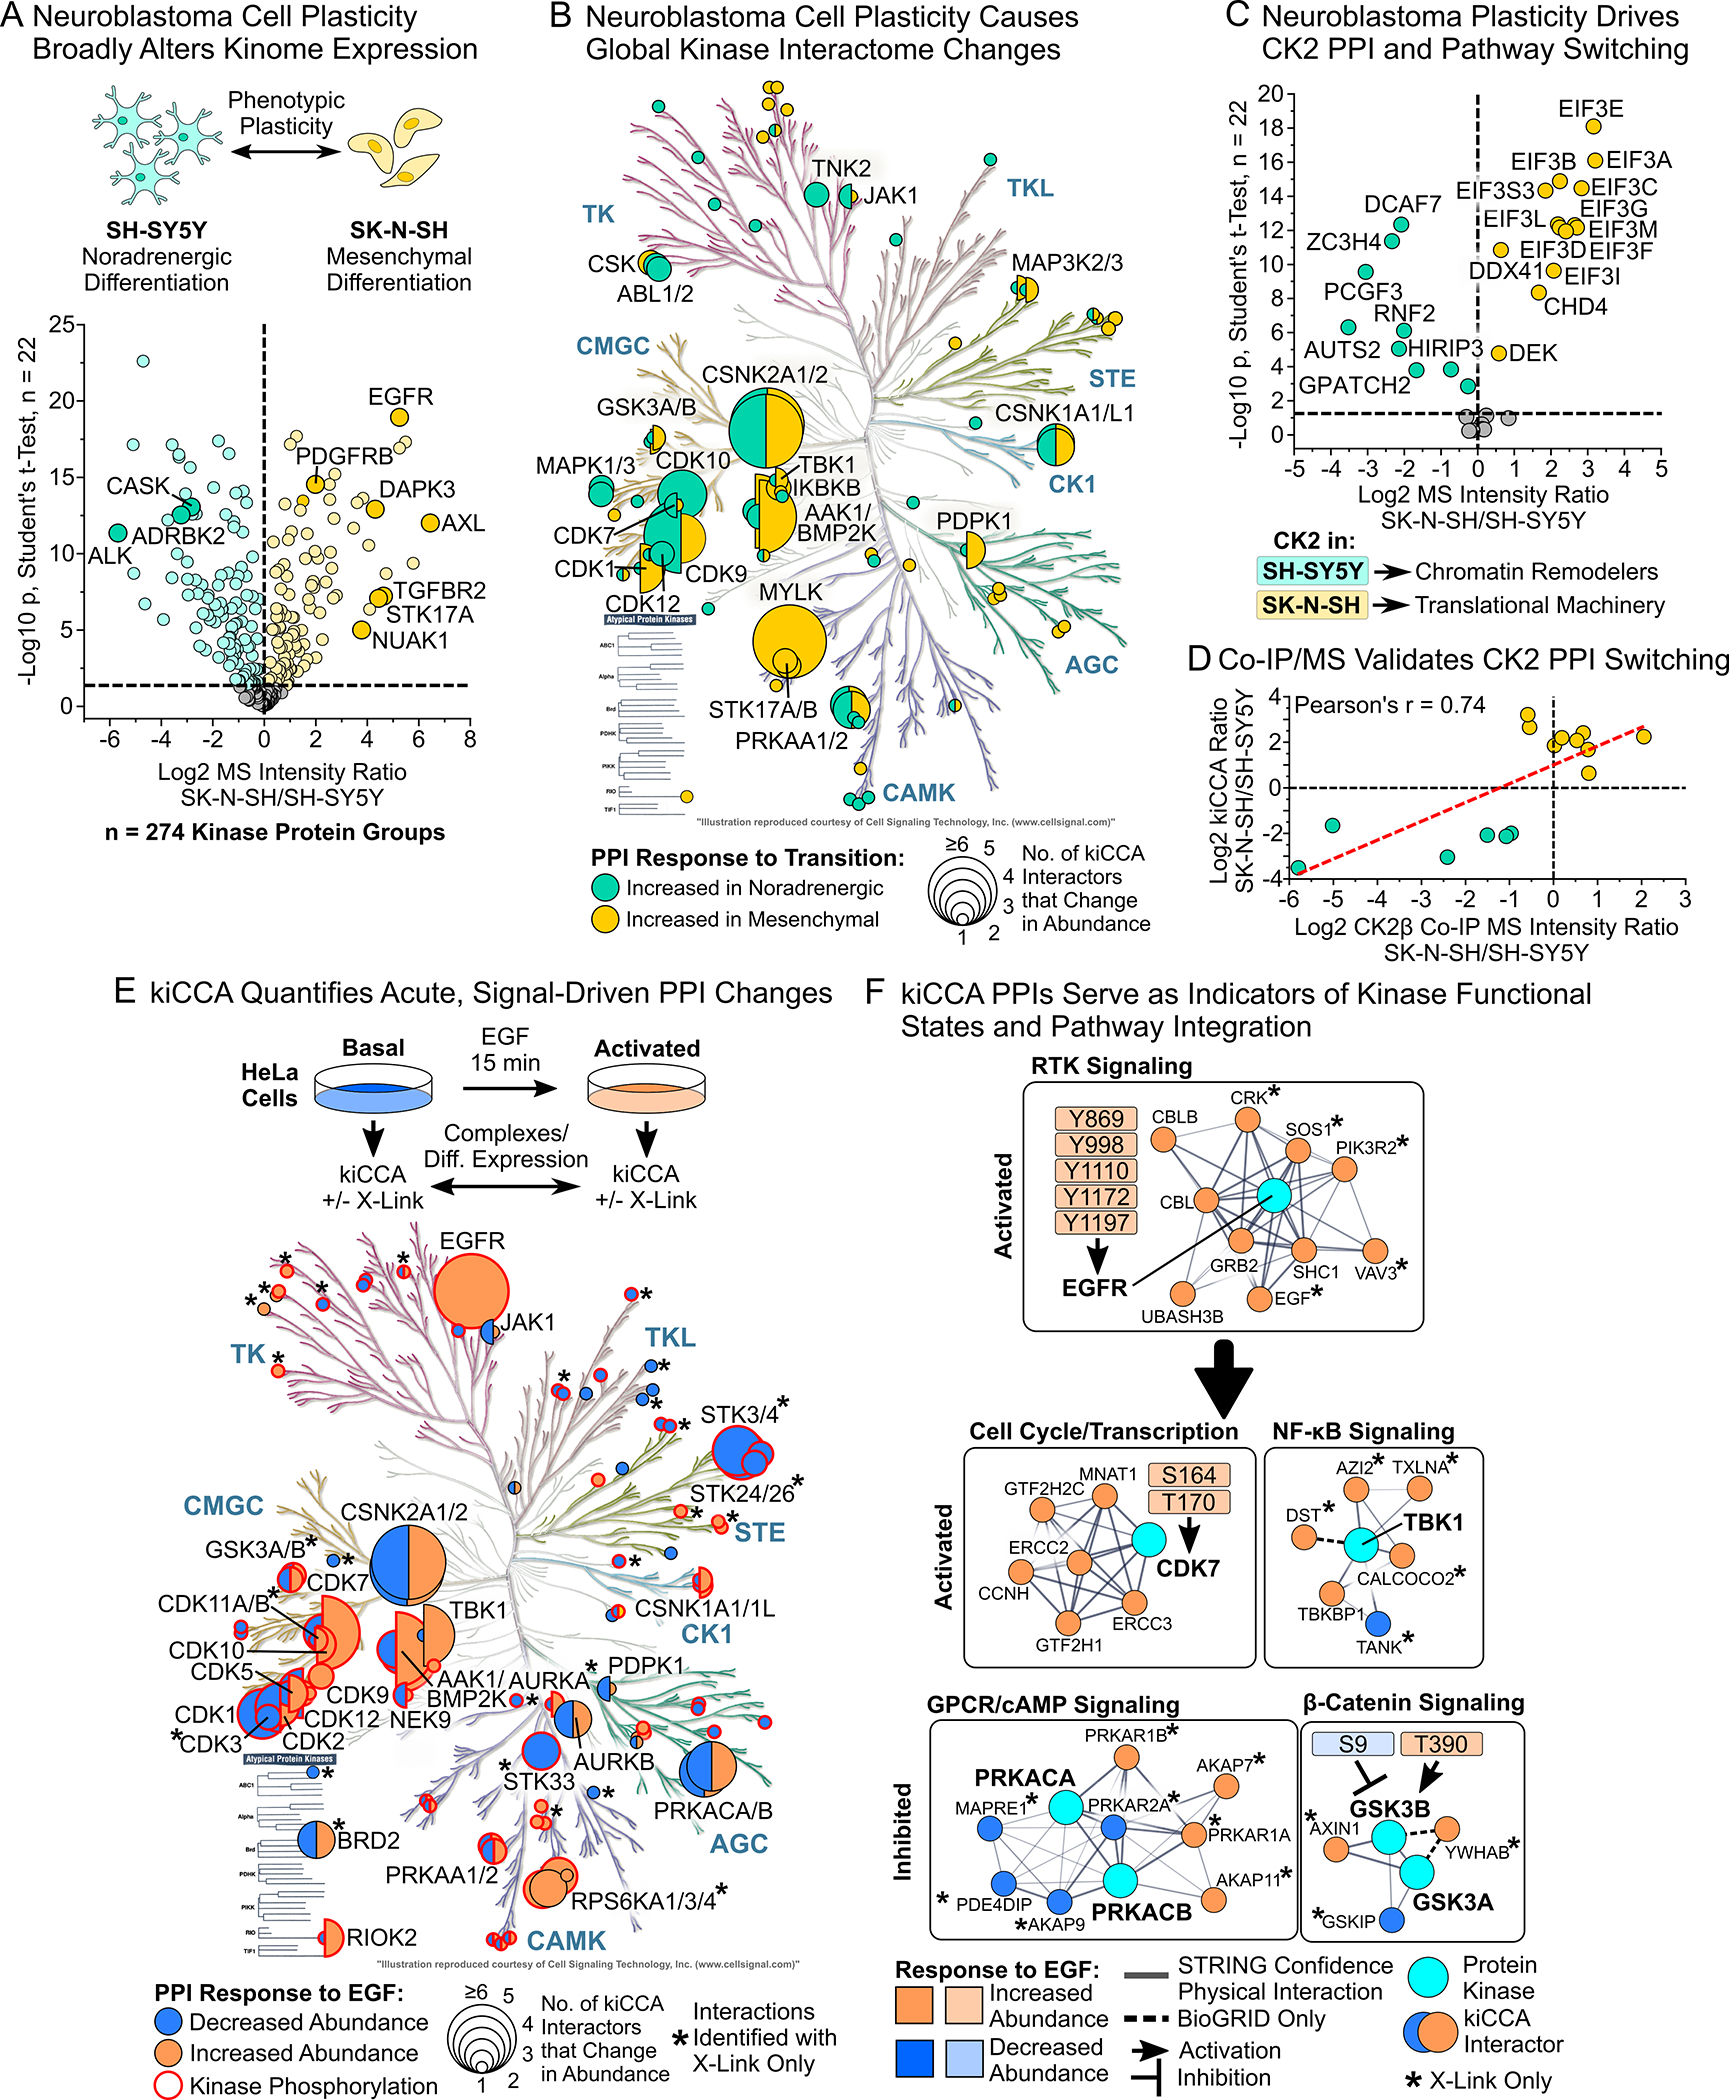
Figure 3. kiCCA quantifies kinome interactome changes caused by cancer cell plasticity and acute signaling events.

(A) Differential expression analysis (DEA) of kiCCA data revealed that the neuroblastoma lines SK-N-SH and SH-SY5Y have kinome profiles indicative of mesenchymal-noradrenergic plasticity (NMP, Student’s t-test, Benjamini-Hochberg (BH)-FDR < 0.05, n = 22). Kinases marking the noradrenergic and mesenchymal phenotype are highlighted.
(B) Kinases with altered PPI abundance between the SK-N-SH and SH-SY5Y neuroblastoma lines (n = 44 kinase groups, DEA statistics see (A)). Circle size scales with the number of kinase-binding partners that change in abundance.
(C) DEA of high confidence kiCCA interactions reveals that 20 members of a CK2 interaction network showed an altered abundance between neuroblastoma lines (statistics see (A)). Pathway enrichment analysis with STRING 11.538 showed that differentially abundant CK2 interactors in either cell line participated in distinct signaling pathways.
(D) Co-IP/MS experiments in the SK-N-SH and SH-SY5Y neuroblastoma lines using specific CK2α/β antibodies confirmed altered abundance of CK2 interaction partners as determined by kiCCA.
(E) Overview of kiCCA of EGF-stimulated HeLa cells and annotated kinases with altered PPI abundance upon EGF treatment (n = 63 kinase groups, for DEA statistics see (A)). Kinases with co-regulated changes in phosphorylation and PPIs are highlighted in red. Kinases marked with an asterisk (*) have PPI changes only detected with protein crosslinking.
(F) kiCCA of EGF-stimulated HeLa cells revealed that abundance changes of PPIs correlated with changes in kinase functional states, connecting the EGFR to several non-canonical EGFR-signaling pathways. Network models were created using STRING 11.5.38
See also Figure S4.
