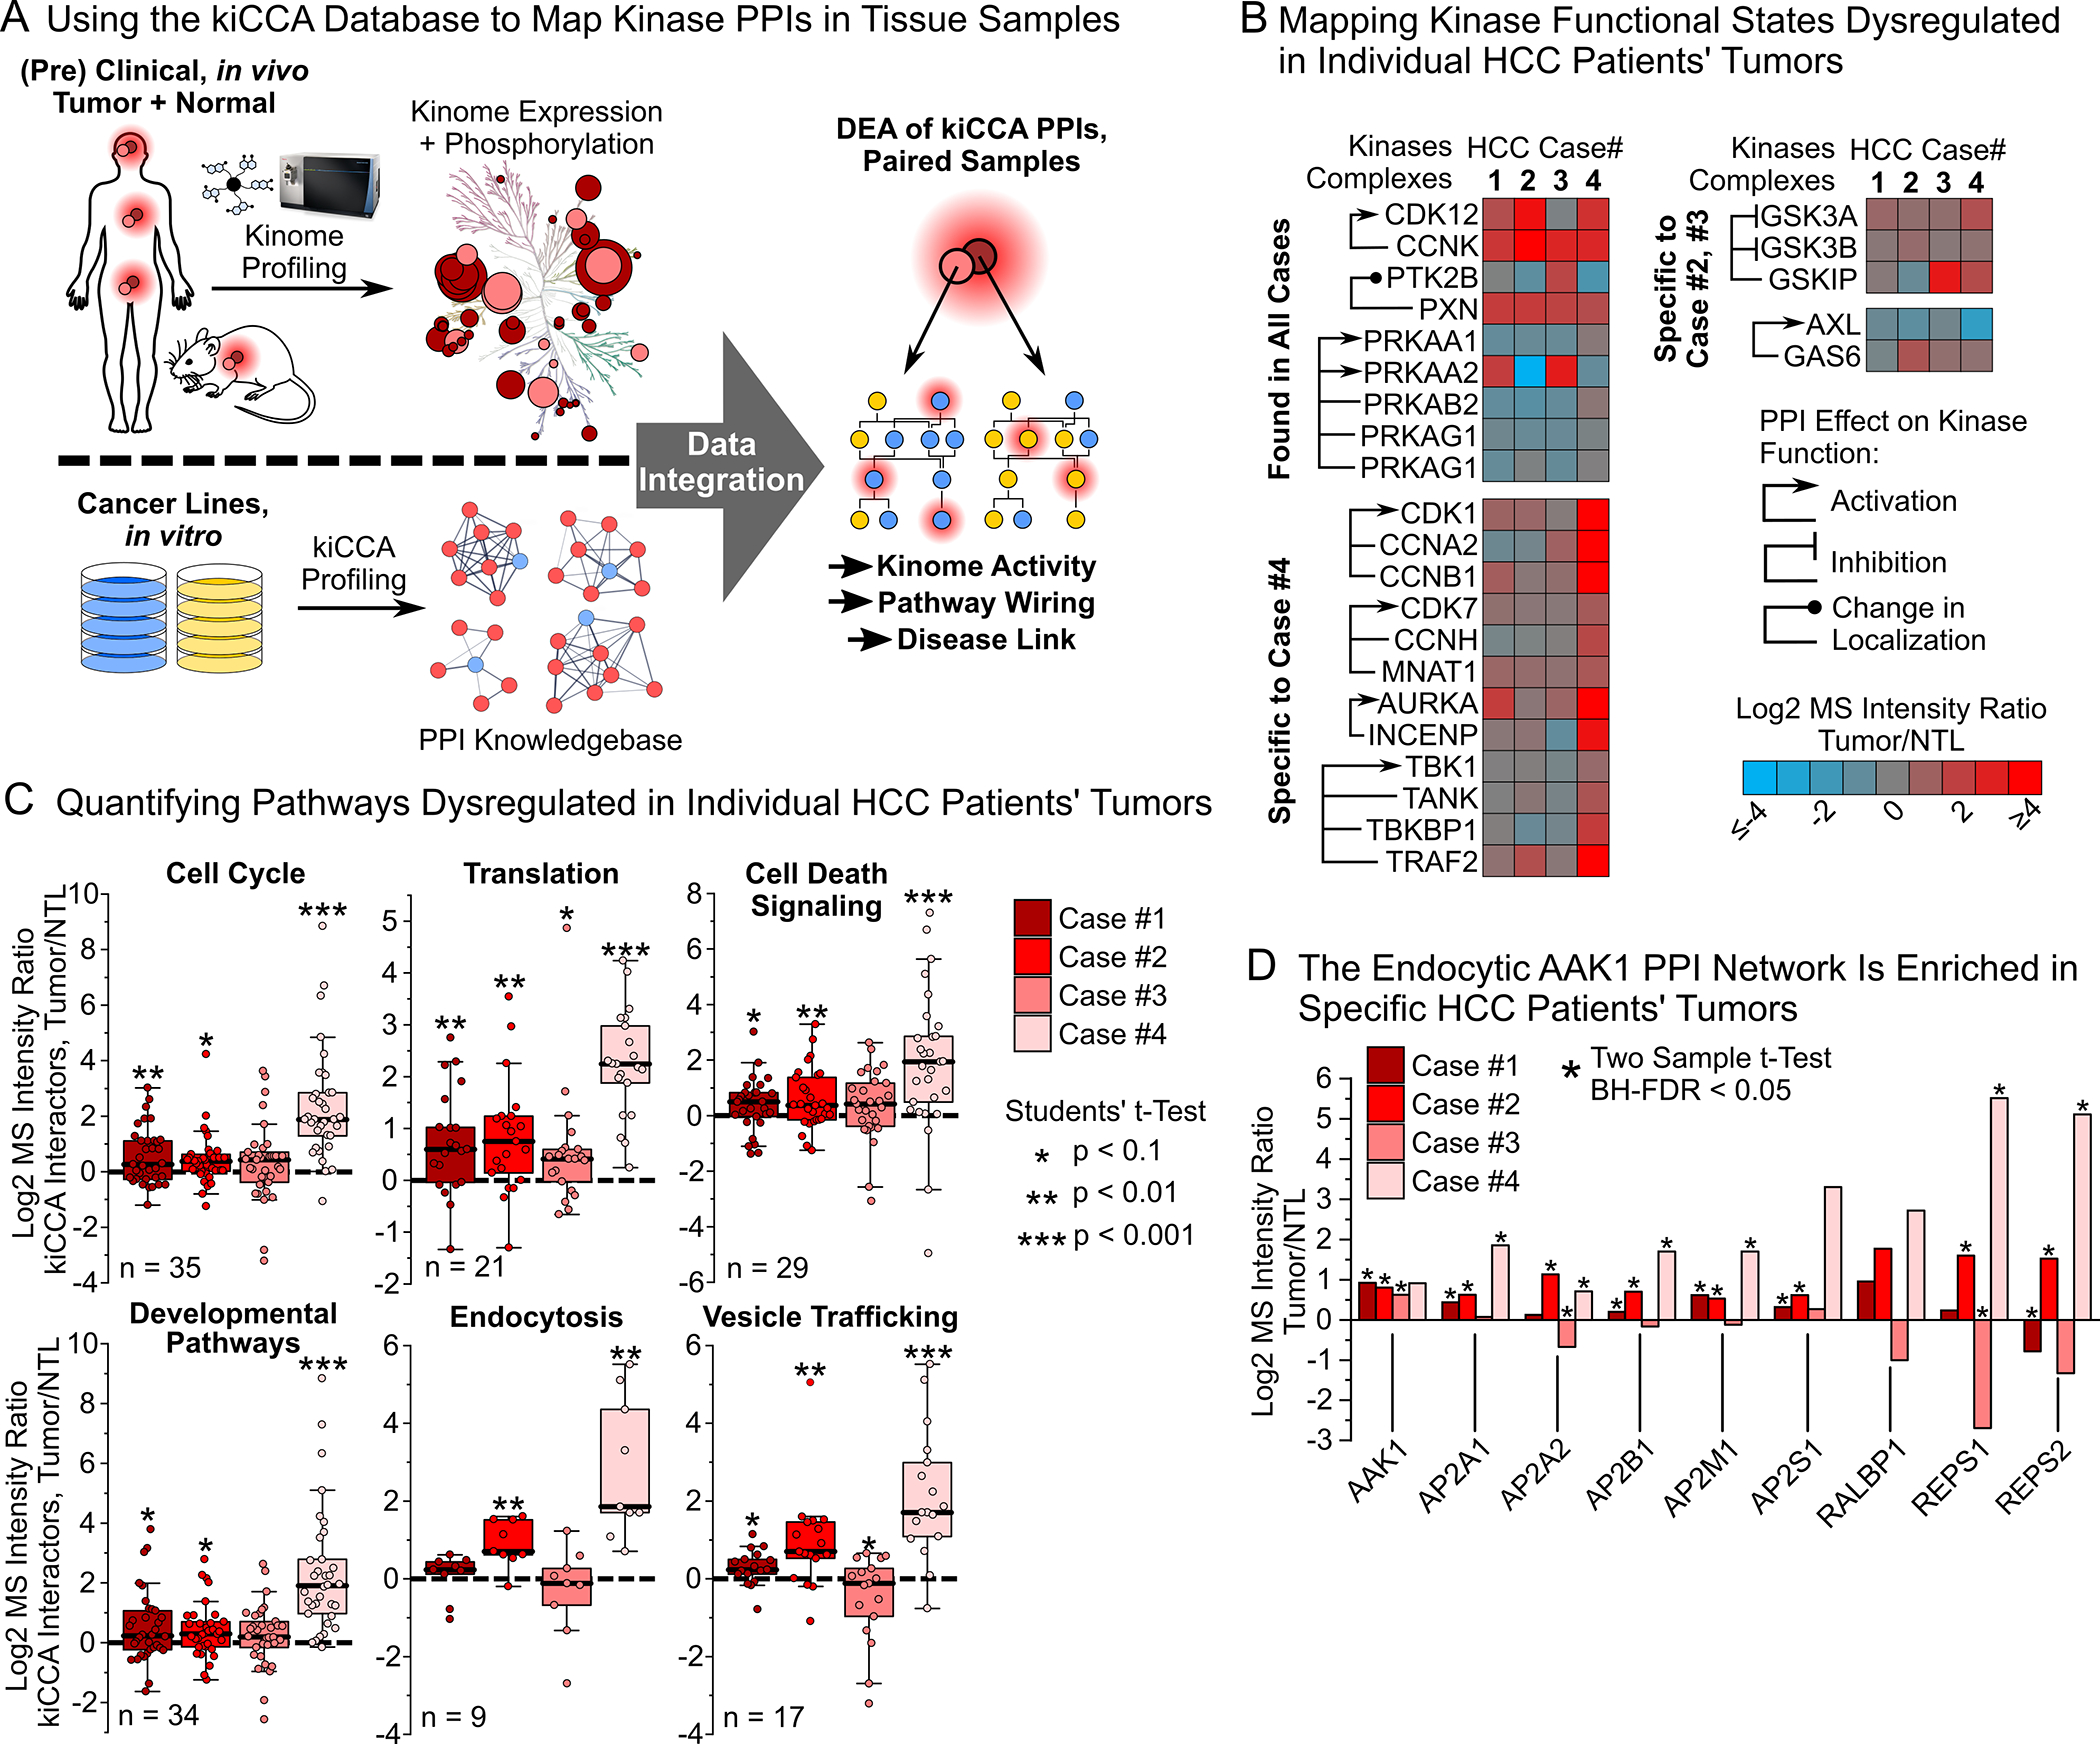
Figure 6. Applying our kiCCA interactome knowledgebase to map kinase PPIs in kinome-centric chemoproteomic datasets from clinical and pre-clinical tissues.

(A) Workflow for interpreting in vivo kinome profiling data from clinical specimens using our kiCCA knowledgebase.
(B) Integrating our kiCCA knowledgebase with kinobead profiling data from four, paired HCC patients’ tumor and non-tumor liver (NTL) samples revealed differential abundance of kinase PPIs, and thus aberrations in kinase functional states in vivo (two sample t-test, BH-FDR = 0.05, n = 5 or 6).
(C) Pathway mapping of kinase PPIs altered between HCC patients’ tumors and paired NTL tissues revealed dysregulation of cellular pathways (for statistics, see (B)). Each datapoint is the log2 MS intensity tumor/NTL ratio of a kiCCA interactor with significantly different abundance in at least one HCC case; all interactions were then compared across all HCC cases.
(D) DEA of the AAK1-mediated PPI network between HCC tumor and NTL tissues revealed frequent upregulation in tumors, suggesting important roles in HCC progression and drug resistance in vivo (for statistics, see (B)).
See also Table S3
