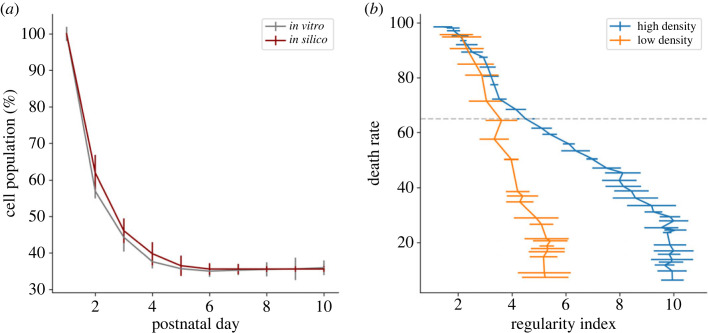
Figure 5.
CD mechanism impact on RGC population. (a) RGC population measured in vitro (grey) and in simulations (dark red). In vitro population at day 1 is an estimation based on a final CD of 65%. Error bars represent s.d. (b) RI score depending on final CD rate in a simulation implementing only the CD mechanism, for selected RGC populations of high density (blue curve, initial density = 571 cells mm−2) and low density (orange curve, initial density = 114 cells mm−2). The horizontal dotted line indicates a death rate of 65%. Error bars represent s.d.

