Fig. 5.
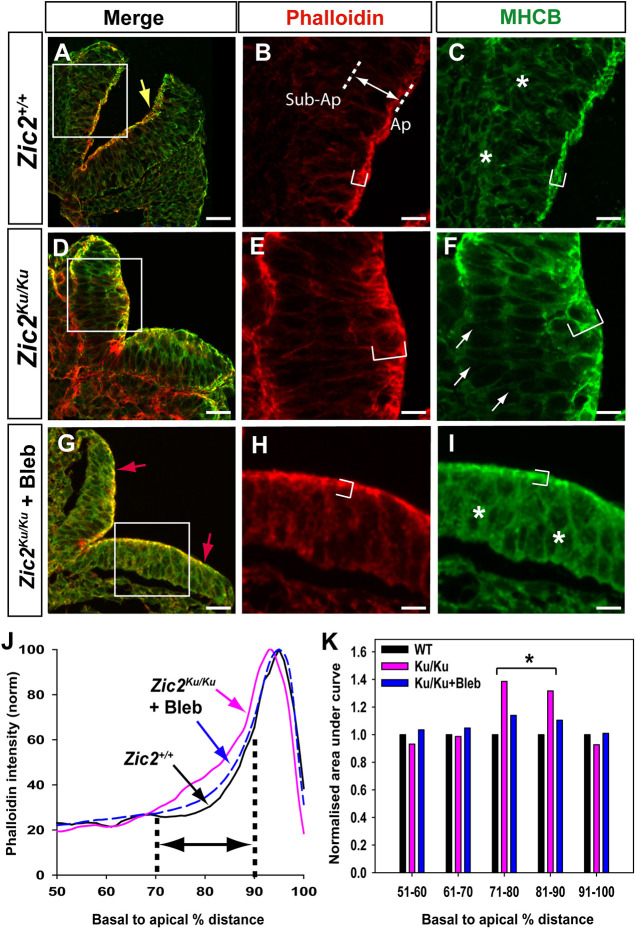
Apical accumulation of actomyosin in pre-spina bifida Zic2Ku/Ku mutants and rescue by Bleb. (A-I) Phalloidin staining of F-actin (red), and anti-MHCB immunostaining (green) on transverse sections through the open PNP at the 15- to 19-somite stage. Embryos are Zic2+/+ (A-C) and Zic2Ku/Ku (D-F) uncultured, and Zic2Ku/Ku cultured in 50 µM Bleb for 6-8 h from the 12- to 16-somite stage (G-I). Merged images are shown at low magnification (A,D,G) with higher magnification of the boxed areas (B,C,E,F,H,I). F-actin and MHCB both occupy extended apical domains in Zic2Ku/Ku neuroepithelium compared with Zic2+/+ neuroepithelium (compare bracketed regions in B,C with those in E,F). MHCB expression in sub-apical and basal neuroepithelium is diminished in Zic2Ku/Ku (arrows in F) compared with Zic2+/+ (asterisks in C). Bleb treatment of Zic2Ku/Ku embryos yields an F-actin and MHCB distribution in the neuroepithelium (G-I) that closely resembles that in wild-type embryos (A-C), although DLHPs (yellow arrow in A) remain absent from mutants (red arrows in G). (J) Phalloidin intensity profiles (normalised to 100%; from images as in B,E,H) along the basal-to-apical neuroepithelial axis of Zic2+/+ (black) and Zic2Ku/Ku (pink) uncultured embryos, and Zic2Ku/Ku embryos exposed to Bleb in culture (blue). Intensity profile scans were performed within a ‘region of interest’ that encompassed at least one-third of each neural hemi-plate. Plot shows the 50% most apical part of each intensity profile, as illustrated by the double arrow in B, between dotted lines marking sub-apical (Sub-Ap) and apical (Ap) positions. (K) Quantitation of areas under the curves (J) for each 10% sector in the 50-100% basal-to-apical neuroepithelial region. Values normalised to wild type (WT) for each 10% sector. Zic2Ku/Ku embryos show significantly more Phalloidin staining in the 71-80% and 81-90% sectors compared with WT embryos (*P<0.001; repeated measures ANOVA on ranks with post-hoc Tukey tests). This corresponds to the basal extension of F-actin staining in mutants (bracket in E). Bleb-treated embryos do not differ from WT embryos (P>0.05), showing rescue of F-actin distribution in mutant neuroepithelium. Scale bars: 30 µm (A,D,G); 12 µm (B,C,E,F,H,I).

