Fig. 1.
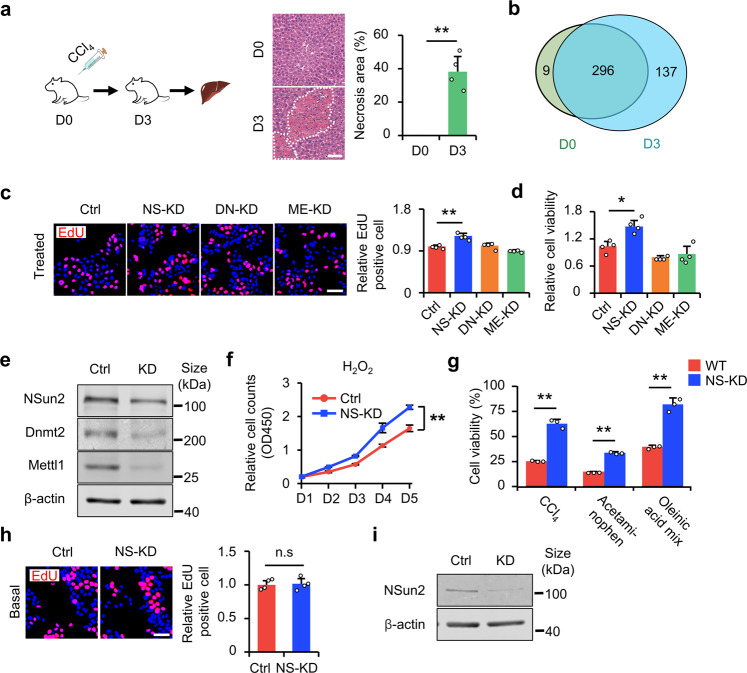
NS-KD alleviates cell injury. a CCl4-induced liver injury. Left panel: schematic of the construction of liver injury mice models. Liver injury was induced by CCl4 injection. The lower part indicates the time, i.e., D0: intraperitoneally (i.p.) injection of CCl4 or vehicle on day 0. D3: assessing the extent of liver injury on day 3. Right panel: H&E staining showing hepatic necrosis following injection of vehicle (D0) or CCl4 (D3). Dotted lines indicate the necrotic or inflammatory area, and the percentage of the necrotic or inflammatory area is quantified. Scale bar, 50 μm; n = 4 mice. b Venn diagram showing the numbers of tsRNAs in the presence or absence of CCl4 stress. The color represents samples with or without CCl4 stress. The numeral is the number of tsRNAs in the corresponding area. The data are acquired by tsRNA-seq, and each group comprised two duplicate samples. c The effect of four tRNA modification enzymes on HL-7702 proliferation under H2O2 stress. Treated: H2O2. Left panel: representative images of EdU staining are shown. Right panel: statistical results. Scale bar, 100 μm. EdU-positive cells were analyzed as data relative to the control n = 4 replicates. d Relative HL-7702 viability (CCK-8 assay) was assessed by detecting the OD450 value. n = 4 replicates. e NSun2 expression was measured to verify the knockdown effect of NSun2 by western blotting in (c) and (d). f Detection of HL-7702 proliferation using CCK-8 assay under H2O2 stress at the indicated time points (day 1, day 2, day 3, day 4, day 5), **P < 0.01, versus control siRNA at day 5. g Detection of transfected HL-7702 cell survival after stimulation with other chemicals. HL-7702 viability was assessed by the CCK-8 assay. n = 3 replicates. h Detection of transfected HL-7702 cell proliferation in the absence of stress damage. Basal: no H2O2. Left panel: representative images of EdU staining. Right panel: statistical results. Scale bar, 100 μm. EdU-positive cells were analyzed relative to the control. n = 4 replicates. i NSun2 expression was measured to verify the knockdown effect of NSun2 by western blotting for (f–h) and Supplementary Fig. S1j. NSun2 siRNA: NS-KD; Ctrl siRNA: Ctrl. All data are expressed as the mean ± SD. *P < 0.05, **P < 0.01, n.s. no significance, Student’s t-test

