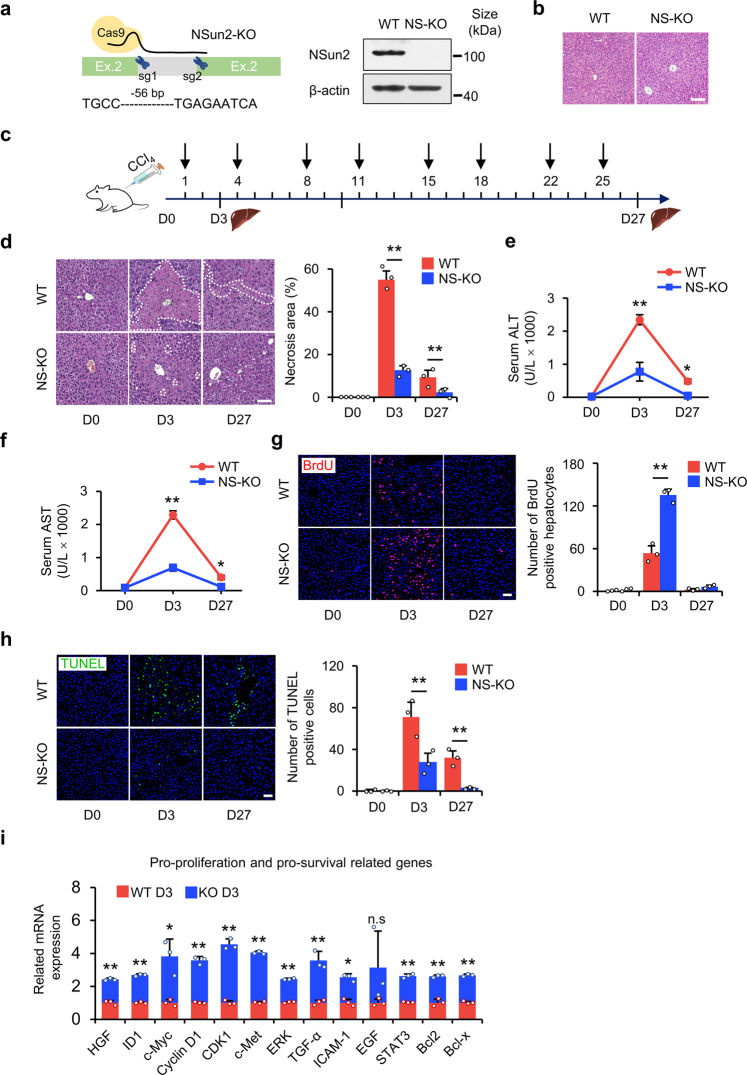
Fig. 2.
NS-KO improves liver necrosis, regeneration, and survival in vivo. a Generation of NS-KO mice. Left panel showing a schematic representation of NS-KO mice, NSun2 genomic locus, and NSun2 deleted locus. The targeting sgRNA was designed to knock out 56 bp DNA fragments in exon 2 of the NSun2 gene. The right panel is genotyping analysis of WT and NS-KO mice confirmed by western blotting. b H&E staining showing mouse liver in WT and NS-KO mice not subjected to stress. Scale bar, 50 μm; n = 3 mice. c Schematic of the construction of liver injury mice models. Liver injury was induced by repeated injections of CCl4. The part above the arrow line of time represents the injection time, and the part under the arrow line represents the liver-obtained time. D0: no injury; D3: day 3 after injury; D27: day 27 after injury. d H&E staining showing hepatic necrosis at different time points after CCl4 injection. Dotted lines indicate the necrotic or inflammatory area and the percentage of the necrotic or inflammatory areas is quantified. Scale bar, 50 μm; n = 3 mice. e, f Mouse serum ALT (e) and AST (f) concentrations were assessed to determine the degree of liver injury after repeated CCl4 injection, n = 4 mice. g Hepatocytes proliferation in liver sections. Three hours before the mice were euthanized, 5-bromodeoxyuridine (BrdU) incorporation was performed for WT and NS-KO mice treated with CCl4 and BrdU-positive hepatocytes were quantified. Scale bars, 200 μm; n = 3 mice. h TdT-mediated dUTP nick end labeling (TUNEL) assay on liver sections of WT mice or NS-KO mice treated with CCl4. Green cells indicate TUNEL-positive (apoptotic) cells. Nuclei were stained with DAPI, and TUNEL-positive nuclei were quantified. Scale bars, 200 μm; n = 3 mice. i Proliferation- and survival-related gene expression was quantified by qRT-PCR after liver injury. n = 3 mice. For data in this figure, representative images are shown. All data are presented as the mean ± SD. *P < 0.05, **P < 0.01, Student’s t-test

