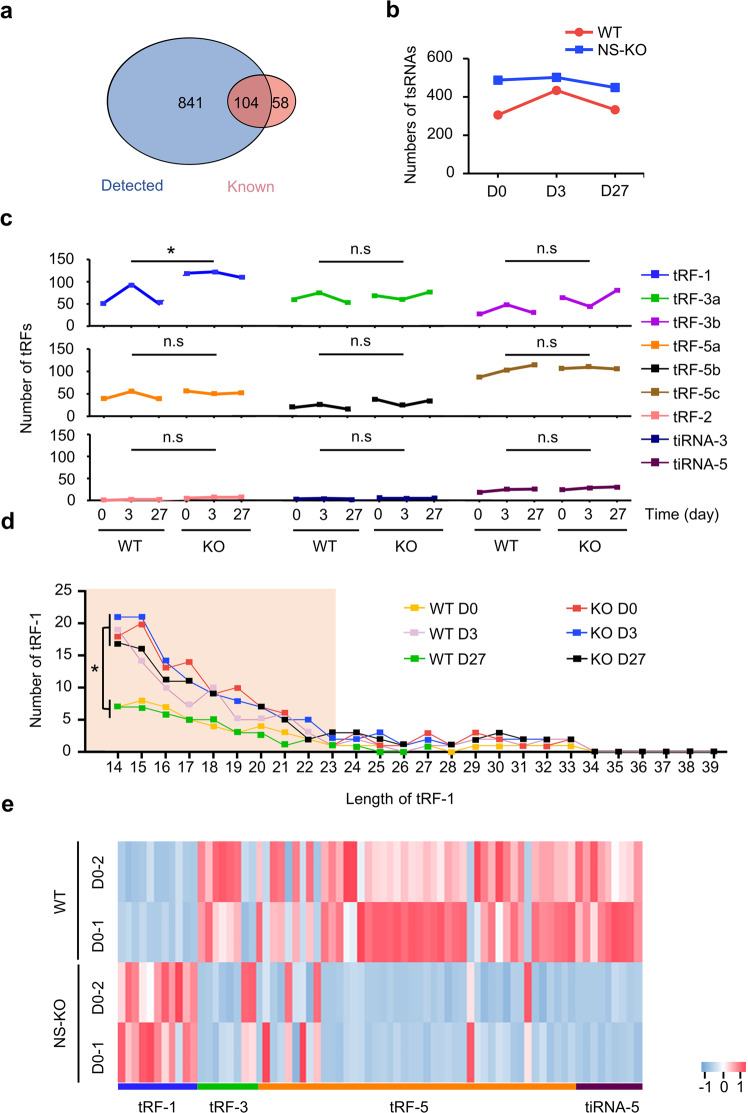
Fig. 4.
tsRNA-seq showing the signature of tRF-1s in WT and NS-KO mice subjected to stress. a Venn diagram showing the known tsRNAs from tRFdb20 and the tsRNAs detected from tsRNA-seq. b Group line chart showing the different number of tsRNAs at different time points in WT and NS-KO mice. D0: day 0: no injury; D3: day 3 after injury; D27: day 27 after injury. n = 2 mice. c Group line chart showing the distribution of subtypes of tsRNAs. The Y-axis represents the number of tsRNAs subtypes. The X-axis represents the injury time points in WT and NS-KO mice. d The number of tRF-1s against the length of tRF-1s reads. A line chart showing the sequence read length distribution in WT and NS-KO mice at different injury time points. The X-axis represents the length of tRF-1s, and the Y-axis represents the number of tRF-1s. The color represents the injury time points in WT and NS-KO mice. e Hierarchical clustering heatmap of differentially expressed tsRNAs (P < 0.05 and log2FC > 2). Each column represents each tsRNA, and all selected tsRNAs are categorized into no more than six clusters based on the tsRNAs subtypes. Each row represents a replicate. The color in the panel represents the relative expression level of the same type of tsRNAs (row normalization by z-score). The color scale is shown on the right: blue represents an expression level below the mean; while red represents an expression level above the mean. All data in this figure are acquired by tsRNA-seq, with two duplicates performed for each group. All data are expressed as the mean ± SD. *P < 0.05, n.s no significance, Student’s t-test

