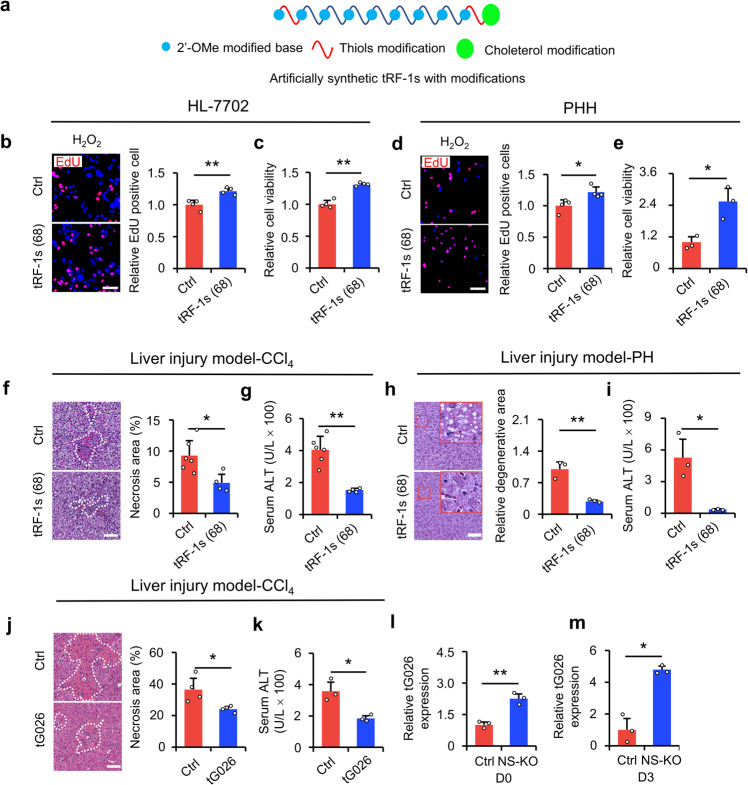
Fig. 5.
Screened tG026 promoted cell proliferation and survival after injury. a The modified pattern of artificially synthesized tRF-1s. b HL-7702 cells were transfected with 68 artificially synthesized tRF-1s. Random code sequence was used as a negative control. EdU-positive cells were analyzed relative to the control. n = 4 replicates. Representative images (left panel) and statistical results (right panel) are shown. Scale bar, 100 μm. c Relative cell viability (CCK-8 assay) was assessed by detecting the OD450 value. n = 4 replicates. d The results of (b) in PHH cells. n = 4 replicates. e The results of (c) in the PHH cells. n = 3 replicates. f, g The effects of injection of 68 synthetic tRF-1s with modifications in vivo in CCl4-induced liver injury. H&E staining (f) and the liver function index, ALT (g), were used to assess the extent of liver injury. Control mice, n = 6; tRF-1s mice, n = 4. h, i The effects of injection of 68 synthetic tRF-1s with modifications in vivo on partial hepatectomy liver. H&E staining (h) and the liver function index, ALT (i), were used to assess the extent of liver injury. n = 3 mice. j, k The effects of injection of synthetic tG026 with modifications in vivo on CCl4-induced liver injury. H&E staining (j) and the liver function index, ALT (k), were used to assess the extent of liver injury. H&E staining, n = 4 mice; ALT measurement, n = 3 mice. l, m The relative expression of tG026 in NS-KO mice at D0 (l) or D3 (m) after injury. D0: no injury; D3: on day 3 after liver injury. n = 3 mice. For data in this figure, control mice received an i.p. injection of random code sequence RNAs. Images shown are representative. Scale bar for H&E staining is 50 μm. All data are presented as mean ± SD. *P < 0.05, **P < 0.01, Student’s t-test

