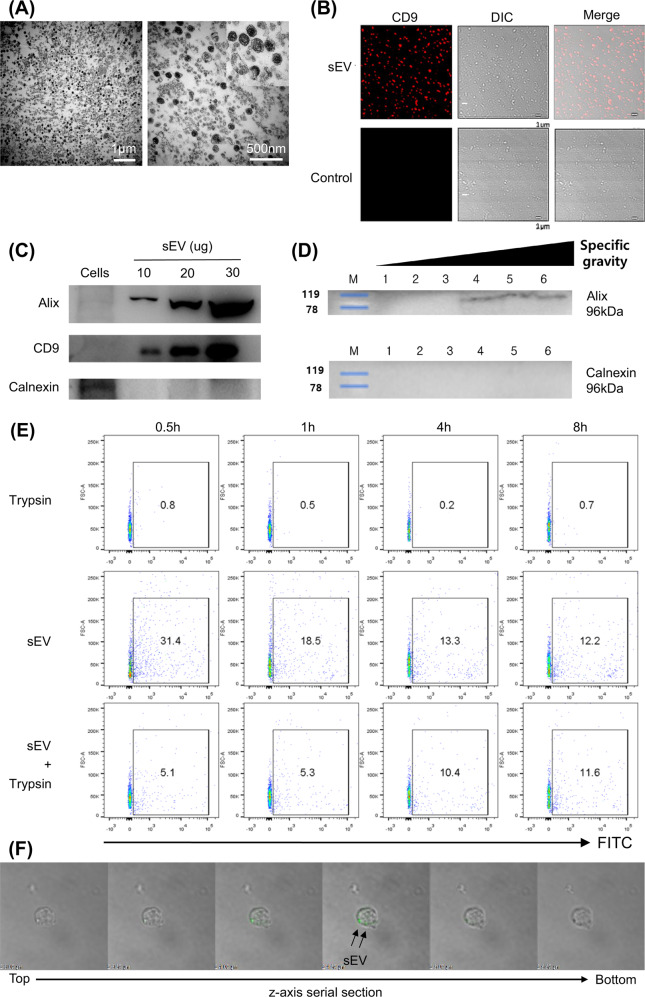
Fig. 1. MSC-sEVs were characterized and were taken up by T cells.
A Transmission electron microscopy (TEM) images of MSC-sEVs. The sEVs were observed with low power (20,000×, left) and high power (60,000×, right). sEVs exhibited a lipid bilayer structure and cup-shaped morphology. Scale bars, 1 µm (left) and 500 nm (right). B sEVs were visualized under a confocal microscope. sEVs were detected with confocal microscopy by Alexa Fluor 555 bound to the murine CD9 and DIC (differential interference contrast) channel (10,000×). C Immunoblots of MSC-sEVs lysates against Alix, CD9, and calnexin. The EV-specific markers Alix and CD9 were detected in proportion to the number of proteins. In contrast, calnexin, an ER membrane-bound protein, was not detected in sEVs. D Determination of the specific gravity. MSC-sEVs were resuspended in 2.5 M sucrose-containing HEPES buffer before ultracentrifugation. A 0.25–2 M sucrose gradient was applied to the suspension (fraction 1–6 = 1.05–1.19 g/ml; 1 = 1.05 g/ml, 2 = 1.10 g/ml, 3 = 1.13 g/ml, 4 = 1.15 g/ml, 5 = 1.1.7 g/ml, and 6 = 1.19 g/ml). The range of the specific density of sEVs measured by sucrose density gradient centrifugation corresponded to 1.15–1.19 g/ml. E Evaluation of EV internalization into T cells. The CD4+ T cells were cocultured with MSC-sEVs labeled with 5 µM CFSE and were trypsinized to remove surface-bound sEVs. The uptake of MSC-sEVs by T cells at different time points was analyzed by FACS. Representative results are shown here. F Confocal microscopy image of MSC-sEVs. CD4+ T cells were incubated with GFP-tagged MSC-sEVs for 17 h, and trypsin was added to remove surface-bound sEVs before observation. Z-axis serial sections of confocal microscopy revealed the ingestion of MSC-sEVs by T cells.

